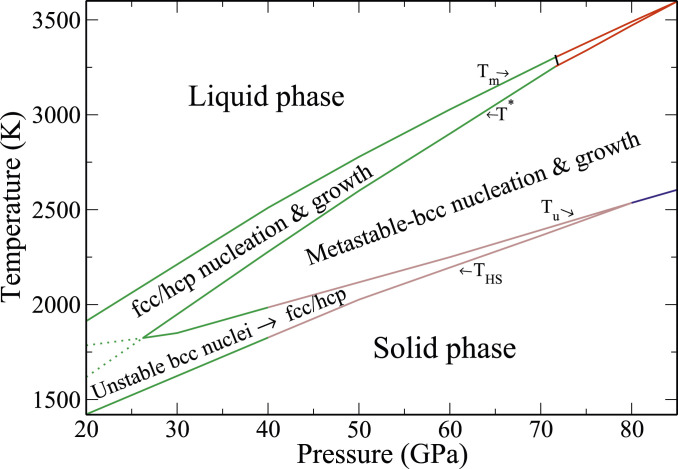
Fig. 5.
A solidification–kinetic phase map. The top and bottom solid lines bound the region where solidification can take place. The four lines in order from top to bottom are 1) the thermodynamic melt line , with the green part depicting liquid/fcc-phase boundary and the red part depicting liquid/hcp; 2) the boundary , where the CNT rate of bcc nucleation equals the fcc rate (green part) or the hcp rate (red part) with a critical nucleation bcc–hcp–fcc triple point at GPa and K; 3) the boundary , below which the postcritical bcc nuclei become unstable and transform to fcc (green part) and mixed fcc/hcp (brown part); and 4) the boundary , below which the liquid phase becomes unstable and crystallization occurs with vanishing nucleation barrier and thus, can be observed in MD simulations. The colors depict the observed crystal phase in the simulations: fcc: green; mixed fcc/hcp: brown; and bcc: blue. The solid parts of the and lines bound the region, where the bcc phase is nucleated inside the bcc–MSCL subspace.

