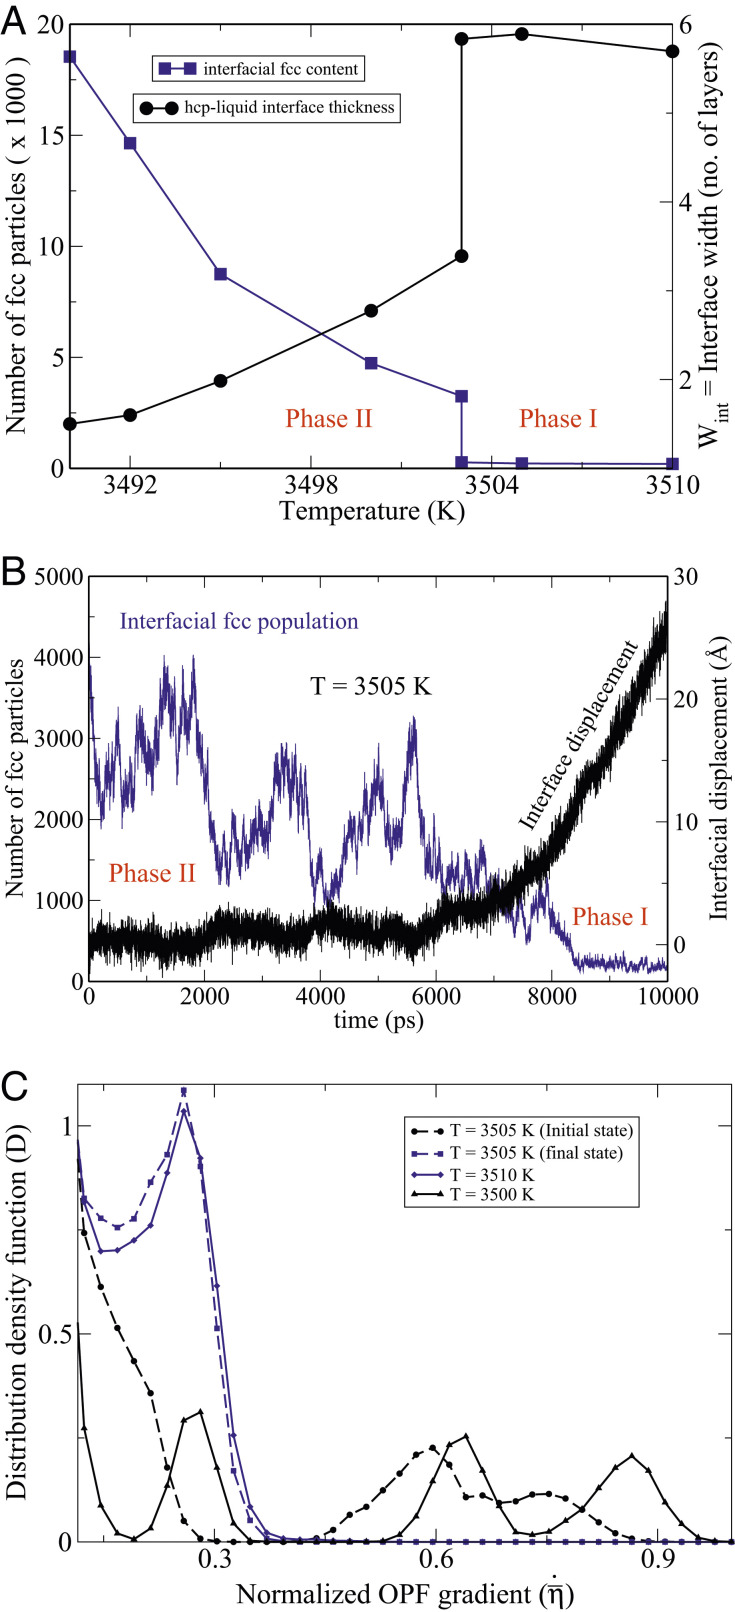
Fig. 7.
(A) The blue curve depicts the number of fcc particles in the system that mainly reside near the (0001)-hcp–liquid interfaces, and the black curve shows the interface widths as a function of temperature. (B) Time evolution of an NPT MD simulation at K, initiated from an (0001)-hcp–liquid equilibrium slab configuration at K. The blue line shows the evolution of the number of fcc particles, while the black line represents for the same simulation the displacements of the (0001)-hcp–liquid interfaces as a function of time, derived from the size fluctuations of the simulation box. The symmetry character of the particles have been identified via the common-neighbor analysis using a cut-off radius of 2.875 Å. (C) The distribution density function . The blue curves depict the distribution functions of the phase I atomically rough interfaces with relatively small OPF gradients, and the black curves show the sharp phase II interfaces with much higher OPF gradients. The dashed lines have been obtained by averaging over the first and the last 2,000 time steps of the simulation shown in B.

