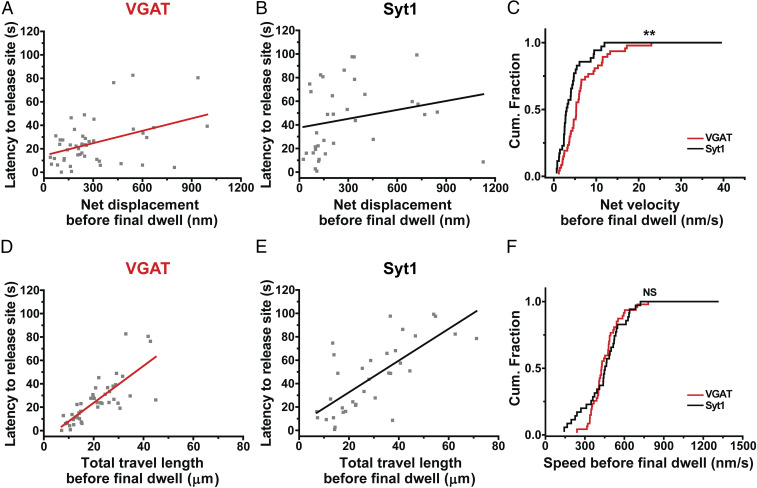
Fig. 4.
GABAergic synaptic vesicles move more straightly to their release sites than Syt1-labeled vesicles. (A) Latency to release site of VGAT–QD-labeled synaptic vesicles (n = 47 vesicles) is plotted against the net displacement before final dwell. Each symbol represents an individual VGAT–QD-loaded GABAergic vesicle, and the red line represents the linear regression (Pearson’s r = 0.42). (B) The relationship between latency to release site and the net displacement before final dwell of Syt1–QD-labeled vesicles (n = 35 vesicles). Each symbol represents an individual Syt1–QD-loaded synaptic vesicle. The black line represents the linear regression (Pearson’s r = 0.23). (C) Cumulative distribution of net velocity before final dwell measured for VGAT–QD-loaded and Syt1–QD-loaded synaptic vesicles. (D) The relationship between latency to release site and the total travel length before final dwell for VGAT–QD-labeled synaptic vesicles. The red line represents the linear regression (Pearson’s r = 0.79). (E) The relationship between latency to release site and the total travel length before final dwell for Syt1–QD-labeled synaptic vesicles. The black line represents the linear regression (Pearson’s r = 0.72). (F) Cumulative distribution of speed before final dwell measured for VGAT–QD-loaded and Syt1–QD-loaded synaptic vesicles. **P < 0.01 and NS, not significant (K-S test).

