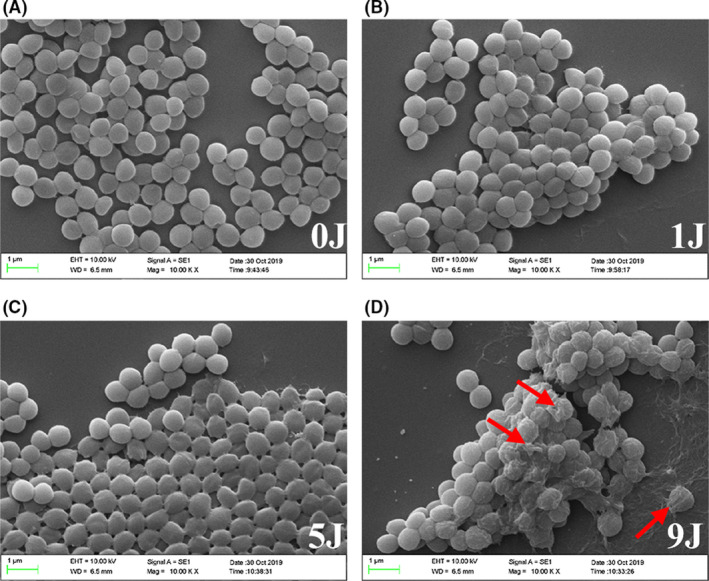
Fig. 3.

Representative scanning electron microscopy images of S. aureus with photodynamic treatment. 500 nM HB was subjected to photoactivation under LED light with a wavelength of 460 nM. The light fluence involved was (A) 0 J cm‐2; (B) 1 J cm‐2; (C) 5 J cm‐2; and (D) 9 J cm‐2. Scale bars correspond to 1 µm. Red arrows indicate representative bacterial cells with morphological atrophies.
A. Intracellular ROS was analysed using DCFH‐DA staining after HB (500 nM) treatment in combination with light irradiation at a density of 1 J cm‐2. Control was designed as HB‐treated sample in dark conditions. Representative fluorescence images are shown in inserts, and scale bar represents 10 µm. With the illumination of 1 J cm‐2 or 9 J cm‐2, enzymatic activities of SOD (B), CAT (C), as well as extracellular leakage of K+ (D) and nucleic acids (E) were shown. Values represent averages of at least triplicate data, and error bars indicate the standard deviation. ***P < 0.001, **P < 0.01, NS P > 0.05.
