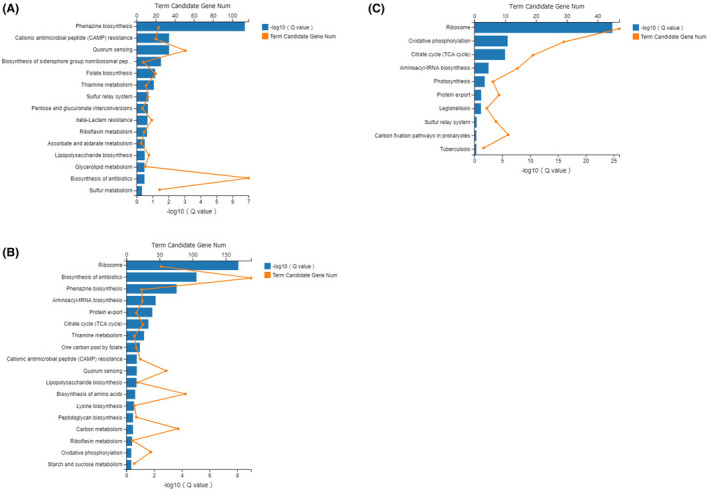
Fig. 2.

KEGG enrichment column maps of differentially expressed genes of the PAO1 strain in the control group, DAS‐treated group and DAE‐treated group based on RNA‐seq (0.00 < q value < 0.05).
A. DAE‐treated group vs. DAS‐treated group.
B. Control group vs. DAS‐treated group.
C. Control group vs DAE‐treated group.
