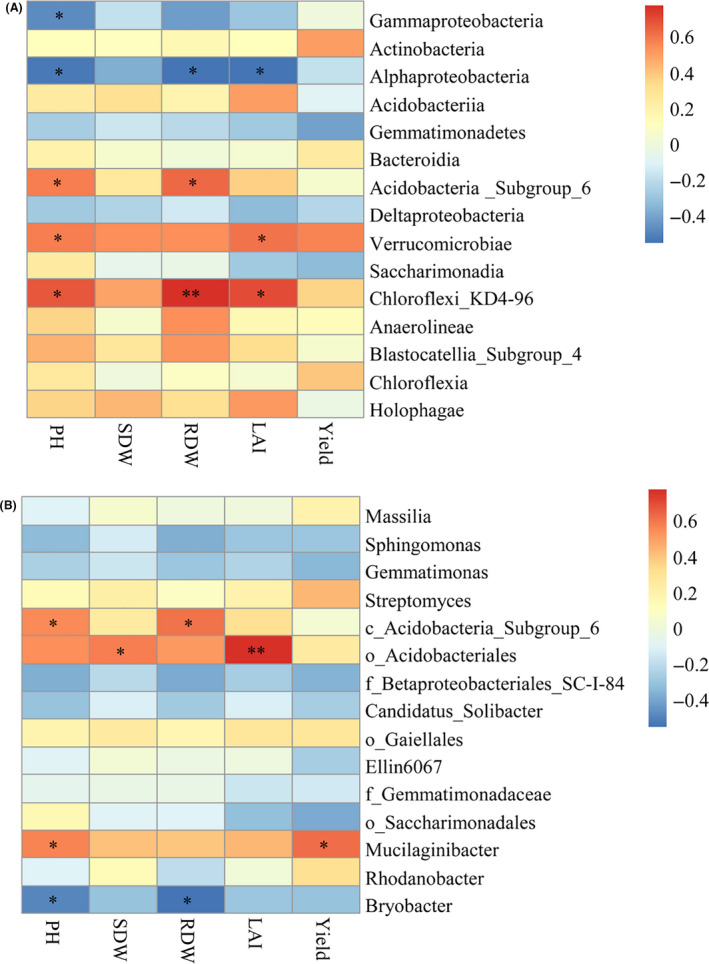
Fig. 5.

Spearman correlation coefficients between the relative abundance of predominant bacteria at the class level (relative abundance > 1%) (A) and the genus level (the 15 most abundant) (B), and plant height (PH), shoot dry weight (SDW), root dry weight (RDW), leaf area index (LAI) at the jointing stage and grain yield (Yield) at the maturation stage. c_, o_ and f_ were unclassified bacteria at the genus level, representing class, order and family respectively; *0.01 < P ≤ 0.05, **P ≤ 0.01.
