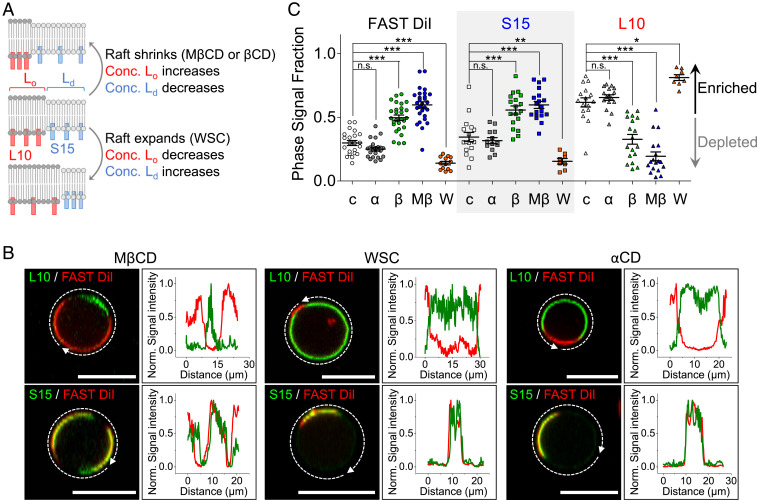
Fig. 2.
Change of domain area by varying cholesterol in the PM. (A) Schematic representation of changes of Lo and Ld size and of the surface density of L10 and S15 during application of cholesterol chelators (MβCD or βCD) or carriers (WSC). (B) Representative GPMV images and line scans in cholesterol-modifying media. L10-YFP (Top) or S15-YFP (Bottom) expressing GPMVs have been chilled to induce PM phase separation. The intensity profiles plot the fluorescence intensity following the white dashed arrows around the GPMVs. (C) Quantification of FAST DiI, S15-YFP, and L10-YFP fractional phase area in GPMVs from three independent experiments. Multiple GPMVs (n) were analyzed for each condition. FAST DiI: (c, control) 0.29 ± 0.01, n = 22; (α, αCD) 0.25 ± 0.01, n = 23; (β, βCD) 0.50 ± 0.02, n = 27; (Mβ, MβCD) 0.60 ± 0.02, n = 28; (W, WSC) 0.14 ± 0.01, n = 13; S15-YFP: (control) 0.34 ± 0.03, n = 17; (αCD) 0.32 ± 0.02, n = 13; (βCD) 0.56 ± 0.03, n = 18; (MβCD) 0.60 ± 0.03, n = 19; (WSC) 0.16 ± 0.02, n = 8; L10-YFP: (control) 0.62 ± 0.04, n = 16; (αCD) 0.66 ± 0.02, n = 16; (βCD) 0.33 ± 0.04, n = 18; (MβCD) 0.20 ± 0.04, n = 18; (WSC) 0.81 ± 0.02, n = 8. *P < 0.05, **P < 0.005, ***P < 0.001, n.s. not significant. Error bars show SEM. (Scale bars, 10 μm.) Conc., concentration.

