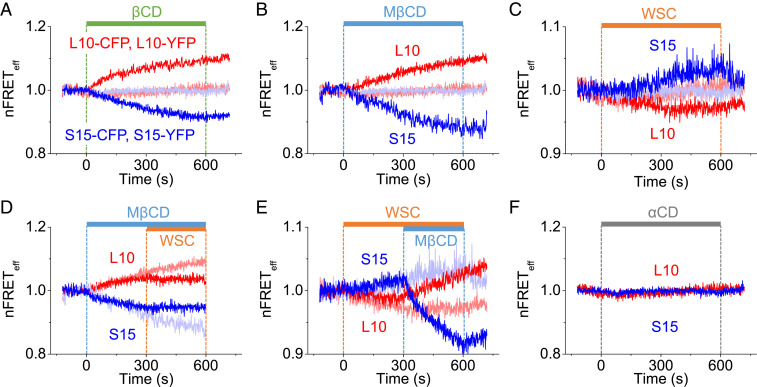
Fig. 3.
Surface density changes of membrane L10 and S15 during cholesterol manipulation in living cells at room temperature. Averaged time courses of the homologous nFRETeff between CFP- and YFP-labeled L10 (red), and between CFP- and YFP-labeled S15 (blue) in separate tsA-201 cells at room temperature. Normalized FRET traces: (A) 5 mM βCD (L10: n = 6 cells, S15: n = 6 cells); (B) 5 mM MβCD (L10: n = 15 cells and S15: n = 14 cells); and (C) 1 mg/mL WSC (L10: n = 5 cells and S15: n = 5 cells). Pale blue and pink lines are αCD control experiments from F. (D) WSC was applied 5 min after application of MβCD (L10: n = 11 cells and S15: n = 8 cells). (E) MβCD was applied 5 min after application of WSC (L10: n = 6 cells and S15: n = 5 cells). Pale blue and pink in D and E come from B and C. (F) 5 mM αCD control (L10: n = 6 cells and S15: n = 6 cells).

