
Fig. 3.
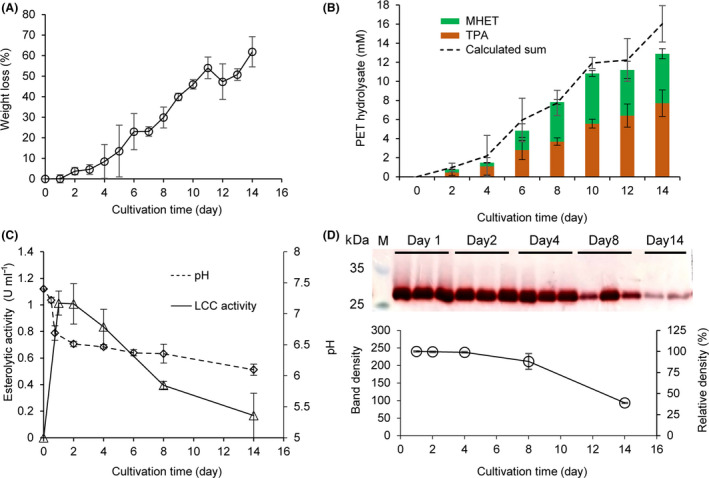
Degradation of amorphous PET films by C. thermocellum DSM1313::pHK‐LCC.
A. Time course of the relative weight loss determined gravimetrically. About 50 mg of PET films were supplemented initially.
B. Time course of the released UV‐absorbing degradation products determined by HPLC in the culture supernatant (stacked columns) as well as calculated sum values based on the weight loss determination (dashed curve, from the same dataset with panel A). The specific concentrations of TPA and MHET are listed in Table S1.
C. Time courses of volumetric esterolytic activity against p‐NPB and pH changes determined in the culture supernatant. Error bars indicate the standard deviation derived from at least triplicate determinations.
D. Specific esterolytic activity analysis determined by Fast‐Red staining. SDS‐PAGE of the culture supernatants (10 μg protein loaded in each lane) removed after cultivation for different time periods following the esterolytic staining with the Fast‐Red dye against 1‐naphthyl acetate as the substrate. The intensities of the violet bands calculated by the Quantity One software indicate the amount of residual specific activities of extracellular LCC.