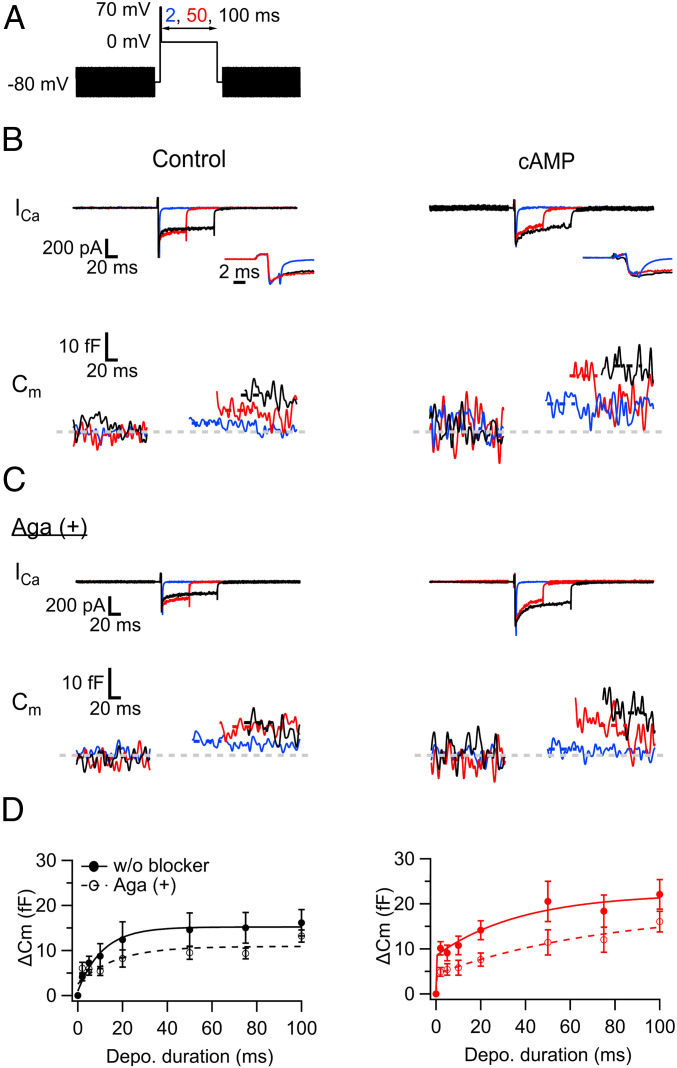
Fig. 5.
cAMP accelerates exocytosis in hMFBs via increasing P/Q-type Ca2+ channel-sensitive release component. (A) Scheme of the pulse. The duration of 0-mV depolarization was varied between 2 and 100 ms, which followed short and strong depolarization (2 ms, 70 mV). The sinusoidal voltage (30 mV, 1,000 Hz) was applied for membrane capacitance (Cm) measurements before and after the depolarization. (B) Ca2+ current and Cm were measured without (control, Left) and with cAMP (0.5 mM) in the patch pipette (Right). The depolarization induced the Ca2+ currents (Top) and elevated the Cm (Bottom). The examples at the 0-mV depolarization for 2 ms (blue), 50 ms (red), and 100 ms (black) are shown. Note that the increase of the Cm caused by the 2-ms depolarization was prominent with cAMP. Insets are the magnified views of the onsets of Ca2+ currents. (C) The same as B, but with data obtained in the presence of ω-agatoxin IVA (Aga, 0.5 μM), P/Q-type Ca2+ channel blocker in the bath solution. Note that the capacitance jump (ΔCm) in response to a 2-ms pulse was inhibited in the presence of cAMP. In B and C, the traces at the 2-ms pulses are the averages of three trials, and the capacitance after the depolarizing pulse was measured at the periods indicated by the dotted lines. Baseline is indicated as a gray dotted line. (D) The ΔCms are plotted against the pulse duration. The panels show the blockage of ΔCms by Aga under the conditions without (Left) and with cAMP in the patch pipette (Right). The filled and open circles represent the ΔCms without and with Aga, and they were fitted by a single (for control) and a double exponential function (for cAMP), whose results are indicated as solid (without Aga) and dashed lines in the graphs (with Aga): 9 to 13 (control) and 10 to 14 (cAMP) without Aga; 8 to 15 (control) and 8 to 13 terminals (cAMP) with Aga.

