Fig. 6.
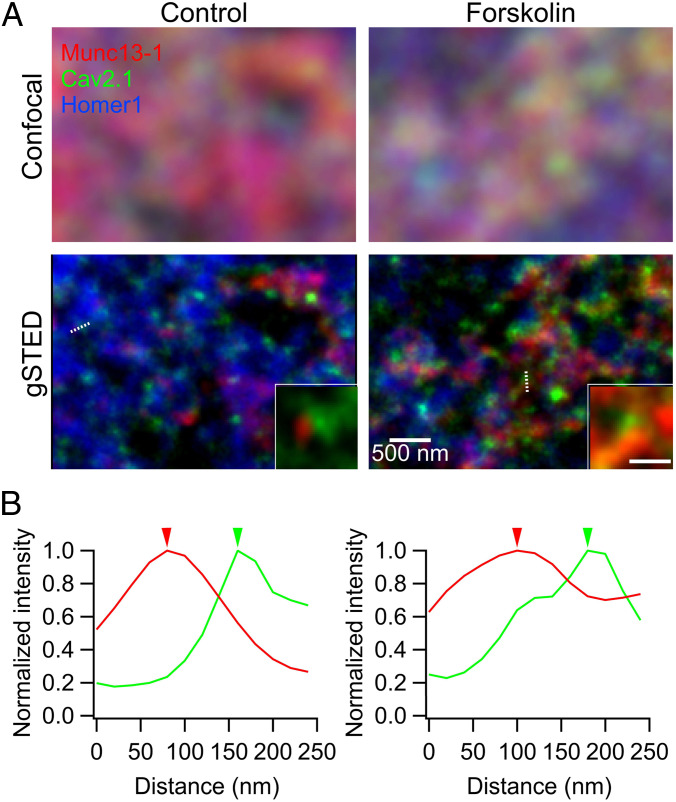
gSTED microscopy reveals Cav2.1 and Munc13-1 clusters at hMFBs. (A) Confocal (Top) and corresponding deconvolved gSTED images (Bottom) of Munc13-1 (red), Cav2.1 (green), and Homer1 (blue) labeled by the specific antibodies in the CA3 stratum lucidum, where MF-CA3 synapses are located, in control (Left) and forskolin-treated (Right) hippocampal slices (150 μm). Munc13-1 and Cav2.1 clusters at release sites were identified as ones opposed to the Homer1 signals (Bottom Insets show clusters on the white dotted lines). (Scale bar for Inset: 200 nm.) (B) Examples of intensity profiles, normalized to the intensity peak, across the line profiles drawn in A for Munc13-1 (red), Cav2.1 (green) in control (Left), and forskolin (Right). Arrowheads indicate the peak locations of Cav2.1 and Munc13-1 clusters (SI Appendix, Fig. S8).

