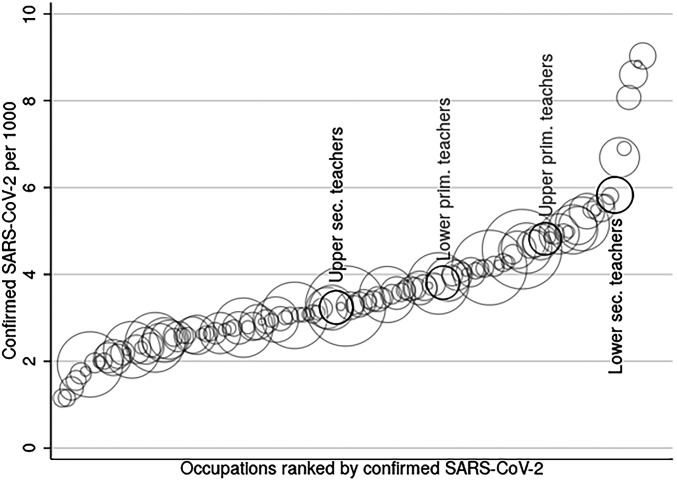
Fig. 3.
SARS-CoV-2 across occupations. Circle size corresponds to the number of employees in each occupation. Incidence (cases per 1,000) of detected SARS-CoV-2 by three-digit occupational codes (SSYK 2012) until June 15, 2020, is shown. Ages are 25–65, and only occupations with at least 1,000 employees are reported. Values for the upper- and lower-secondary teachers (as well as lower- and upper-primary teachers in gray) from the Teacher Register in our sample are indicated in black.

