Fig. 4.
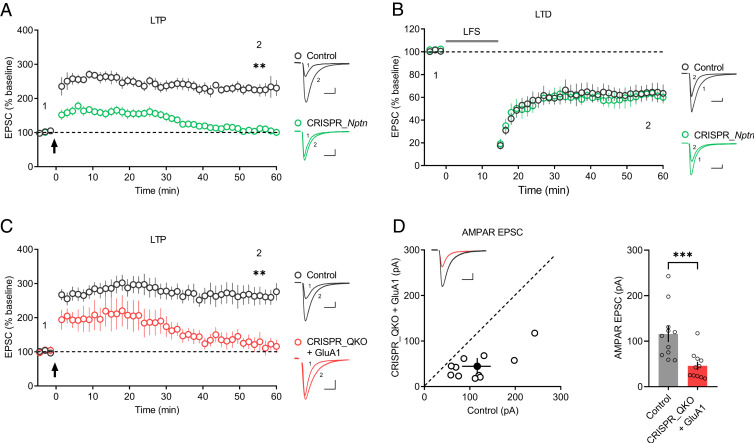
Neuroplastin deletion blocks LTP maintenance. (A and B) Plots show the mean ± SEM. AMPAR-EPSC amplitude of CRISPR_Nptn-transfected (green) and untransfected (control) (gray) CA1 pyramid neurons normalized to the mean AMPAR-EPSC amplitude before the induction of (A) LTP (arrow) (control: n = 7; CRISPR_Nptn: n = 10; four mice; **P < 0.01 at 55.5 min) and (B) LTD (LFS [low-frequency stimulation]) (control: n = 9; CRISPR_Nptn: n = 9; four mice; P = 0.535 at 55.5 min). Representative AMPAR-EPSC current traces from control (gray) and transfected (green) neurons before and after LTP (A) and LTD (B) are shown to the right of the graphs. (C) Plots show the mean ± SEM. AMPAR-EPSC amplitude of transfected (red) and untransfected (control) (gray) neurons normalized to the mean AMPAR-EPSC amplitude before the induction of LTP (arrow) (control: n = 11; CRISPR_QKO + GluA1: n = 8; five mice; **P < 0.01 at 55.5 min). Representative AMPAR-EPSC current traces from control (gray) and transfected (red) neurons before and after LTP are shown to the right of the graphs. (D) Scatterplots show the AMPAR-EPSC amplitudes of single pairs (open circles) of control and transfected neurons; filled circle represents the mean ± SEM amplitude. Insets show sample traces from control (gray) and transfected cells (red). The bar graph to the right of the scatterplots shows the mean AMPAR-EPSC amplitude ± SEM of neurons transfected with CRISPR_QKO + GluA1 and untransfected neurons (control) (control: 116 ± 17.7; CRISPR_QKO + GluA1: 45.8 ± 8.94; n = 11 pairs; five mice; ***P < 0.001). (Scale bars, 25 pA, 25 ms.)

