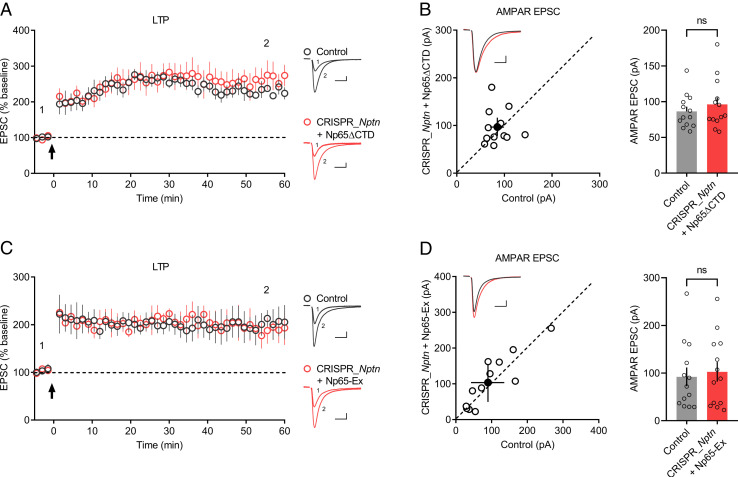
Fig. 6.
The extracellular domain of Np65 is required for LTP maintenance. (A and C) Plots show the mean ± SEM. AMPAR-EPSC amplitude of control (gray) and transfected (red) CA1 pyramid neurons normalized to the mean AMPAR-EPSC amplitude before LTP induction (arrow). Experiments were performed in neurons transfected with (A) CRISPR_Nptn + Np65ΔCTD (control: n = 7; CRISPR_Nptn + Np65ΔCTD: n = 7; three mice; P = 0.400 at 55.5 min) or (C) CRISPR_Nptn + Np65-Ex (control: n = 7; CRISPR_Nptn + Np65-Ex: n = 8; four mice; P = 0.7302 at 55.5 min). Representative AMPAR-EPSC current traces from control (gray) and transfected (red) neurons before and after LTP are shown to the right of the graphs. (B and D) Scatterplots show amplitudes of AMPAR-EPSC for single pairs (open circles) of control and transfected neurons; filled circle represents the mean ± SEM amplitude. Insets show representative traces from control (gray) and transfected cells (red). The bar graphs to the right of the scatterplots show the mean AMPAR-EPSC amplitude ± SEM of neurons transfected with (B) CRISPR_Nptn + Np65ΔCTD (control: 86.4 ± 6.58; CRISPR_Nptn + Np65ΔCTD: 96.2 ± 9.73; n = 13 pairs; three mice; P = 0.4973; ns: not significant) or (D) CRISPR_Nptn + Np65-Ex (control: 92.3 ± 19.7; CRISPR_Nptn + Np65-Ex: 103 ± 20.6; n = 13 pairs; four mice; P = 0.2439; ns: not significant). (Scale bars, 25 pA, 25 ms.)

