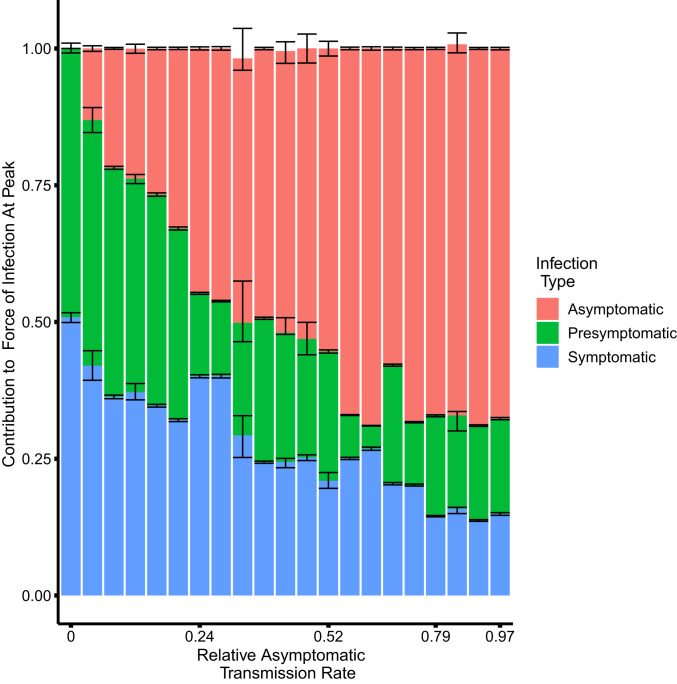
Fig. 4.
The contribution to the force of infection at the peak of the outbreak on April 14, 2020 from symptomatic, asymptomatic, and presymptomatic infections under different relative asymptomatic transmission rates . For each parameter combination from the fitted SEPIAR model supported by case and serology data (corresponding to the points in Fig. 3), we simulate 100 trajectories and calculate the proportion of the overall force of infection on April 14, 2020 that is due to asymptomatic, symptomatic, and presymptomatic infections. We pool trajectories from all parameter combinations that have the same value of , and calculate the median, 2.5%, and 97.5% quantiles for each infection class and value of . The colored bars represent, for each infection class, the median proportion of its contribution to the force of infection (and hence may not sum exactly to one). The error bars represent the corresponding 2.5% and 97.5% quantiles. Versions of this plot calculated 4 wk before and 4 wk after the peak can be found in SI Appendix, Fig. S9. We excluded two outlier parameter combinations that had extremely low relative rates of presymptomatic transmission (i.e., where was less than 0.02).

