Fig. 1.
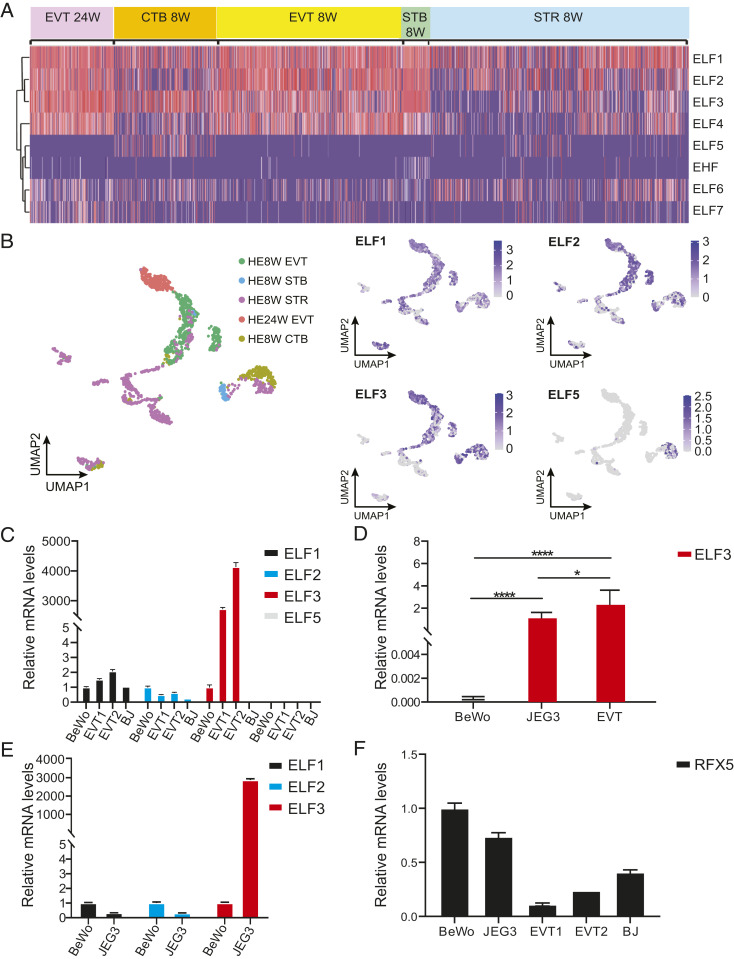
Trophoblast expression of ETS class II genes and RFX5. (A) Clustering of ETS class II genes in placental cells from single-cell sequencing data. Placental cells are clustered into five subpopulations: 24-wk extravillous trophoblasts (EVT_24W), 8-wk cytotrophoblasts (CTB_8W), 8-wk EVTs (EVT_8W), 8-wk syncytiotrophoblasts (STB_8W), and 8-wk stromal cells (STR_8W). (B) Umap analysis of the scRNA-seq data. Expression levels of ELF1, ELF2, ELF3, and ELF5 genes in human placenta cells are shown. (C) ELF1, ELF2, ELF3, and ELF5 mRNA levels in BeWo, BJ fibroblasts, and two primary EVTs by qPCR. (D) ELF3 mRNA levels in BeWo, JEG3, and six primary EVT samples. (E) ELF1, ELF2, and ELF3 mRNA levels in BeWo and JEG3 by qPCR. (F) RFX5 mRNA levels in BeWo, JEG3, primary EVTs, and BJ fibroblasts by qPCR. qPCR was done in triplicate. Data are reported as the mean ± SD. Unpaired t test. *P < 0.05; ****P < 0.0001.

