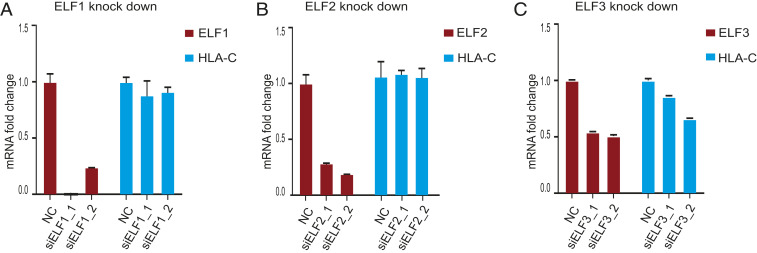
Fig. 2.
HLA-C expression after ETS gene knockdown. (A) ELF1 and HLA-C mRNA levels in JEG3 after ELF1 knockdown by indicated siRNAs. The result shown here is a representative of two independent experiments. (B) ELF2 and HLA-C mRNA levels in JEG3 after ELF2 knockdown. The result shown here is a representative of two independent experiments. (C) ELF3 and HLA-C mRNA levels in JEG3 after ELF3 knockdown. The result shown here is a representative from three independent experiments. qPCR was done in triplicate. Data are reported as the mean ± SD.

