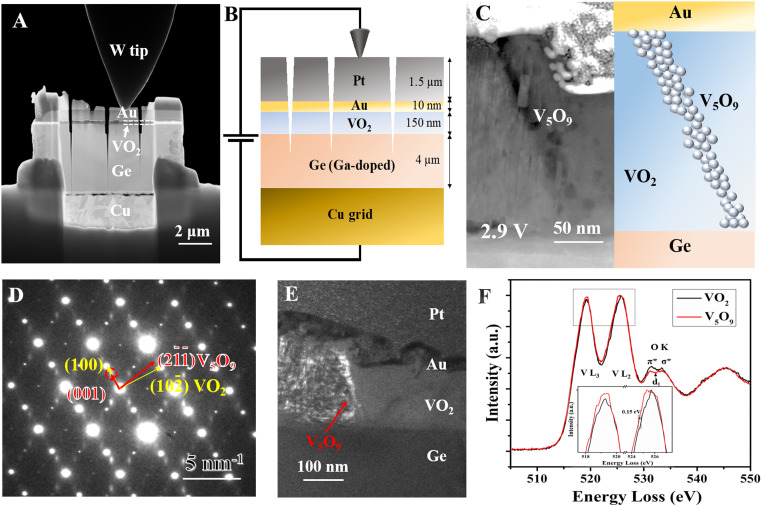
Fig. 2.
Operando TEM studies showing the formation of conductive filament. (A and B) HAADF image and schematic diagram of the experimental setup of the VO2 device. Each FIB sample has three vertical cuts, making two out-of-plane devices. (C) Experimental image and the corresponding schematic of the conductive filament. (D) SAED acquired from the conductive filament area. (E) Dark-field image using the diffraction spot marked by red circle ((001) of V5O9) in D. (F) Core-loss EELS for VO2 and V5O9. Approximately 0.15-eV energy shift is found for the V5O9.

