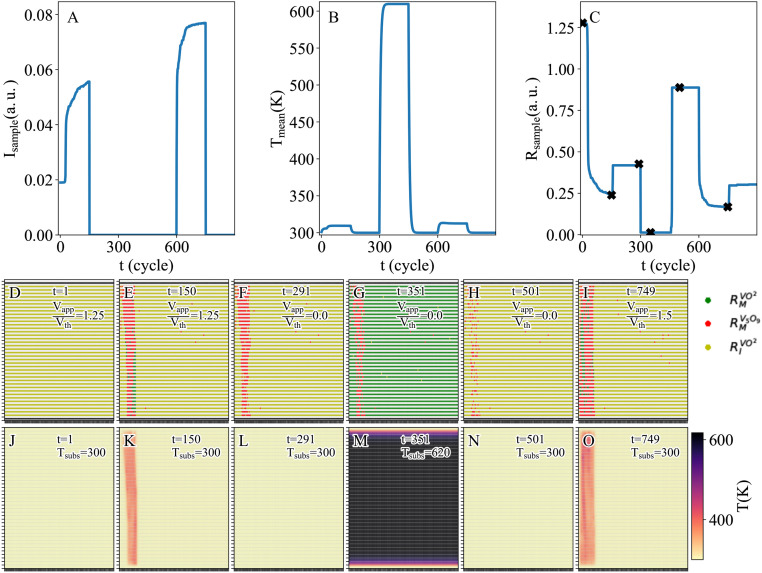
Fig. 5.
Numerical simulations showing the formation and relaxation processes of conductive filaments at room temperature. (A) Electric current of the resistor network as a function of time. A first voltage pulse of Vapp/Vth = 1.25 is applied from t = 1 to t = 150 and a second one of Vapp/Vth = 0.85 is applied from t = 600 to t = 750. (B) Average temperature through the network as a function of time. The small variation in the sample temperature at 300 K is due to the applied voltage that induces local Joule heating. The substrate temperature is increased up to 620 K for annealing purpose at 300 < t < 450 and 750 < t < 1200. (C) Resistivity of the resistor network as a function of time. (D–I) Distributions of metallic rutile VO2 (green), V5O9 phase (red), and insulator M1 VO2 (yellow) at different stages: (D) t = 1 (starting position); (E) t = 150 (during first pulse voltage of Vapp/Vth = 1.25); (F) t = 291 (after relaxation of the first pulse); (G) t = 351 (during the first annealing process); (H) t = 501 (after the first annealing process); (I) t = 749 (the second pulse with smaller stimuli). These different stages are marked as stars in C. Note, the t is the simulation step. (J–O) The corresponding temperature distributions in degrees Kelvin. The whole simulation is shown in Movie S3.

