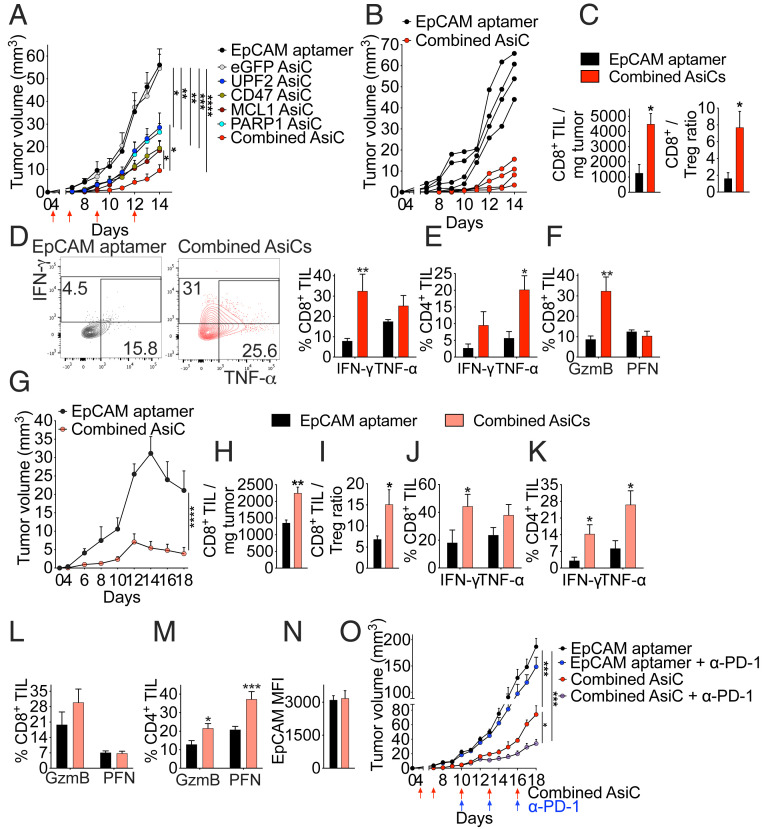
Fig. 4.
Combination of immune-modulating EpCAM-AsiC enhances tumor suppression. (A) Orthotopic 4T1E tumor growth in mice treated as indicated (red arrows) with EpCAM aptamer or EpCAM-AsiC targeting Upf2, Cd47, Mcl1, or Parp1, individually or in combination, or eGFP as control. (B) Growth of 4T1E tumors in individual mice treated with either EpCAM aptamer or the four EpCAM-AsiC combination. (C–F) Mice treated as in A were killed on day 14 and tumors were analyzed by flow cytometry. (C) Numbers of CD8+ TIL per milligram of tumor (Left) and CD8+/CD4+Foxp3+ Treg ratio (Right). (D) Percentage of CD8+ TIL producing IFN-γ and TNF-α after PMA and ionomycin stimulation. Shown at Left are representative flow plots. (E) Percentage of CD4+ TIL producing IFN-γ and TNF-α induced by PMA and ionomycin. (F) Percentage of CD8+ TIL staining for GzmB and PFN. (A–F, n = 4). (G) Growth of 4T1E-eGFP tumors in mice treated with EpCAM aptamer or the four EpCAM-AsiC combination. (H–N) Mice treated as in G were killed on day 18 and tumors were analyzed by flow cytometry. (H) Numbers of CD8+ TIL per mg of tumor. (I) CD8+/CD4+Foxp3+ Treg ratio. (J and K) Percentage of CD8+ (J) and CD4+ (K) TIL producing IFN-γ and TNF-α after PMA and ionomycin stimulation. (L and M) Percentage of CD8+ (L) and CD4+ (M) TIL staining for GzmB and PFN. (N) EpCAM MFI of eGFP+ tumor cells. (G–N, n = 5). (O) Growth of 4T1E tumors in mice treated with EpCAM aptamer or the combined AsiC (red arrows) in combination with anti-PD-1 or isotype control antibody (blue arrows) (n = 4). Data shown are mean + SEM. Statistical tests: (A, G, and O) tumor growth curves were compared by calculating the area under the curve values for each sample followed by one-way ANOVA with Holm–Sidak’s multiple comparisons or Student’s t test. (C, H, and N) Student’s t test. (D–F and J–M) Multiple t tests with Holm–Sidak corrections. (I) Mann–Whitney test. *P ≤ 0.05, **P ≤ 0.01, ***P ≤ 0.001, ****P ≤ 0.0001.

