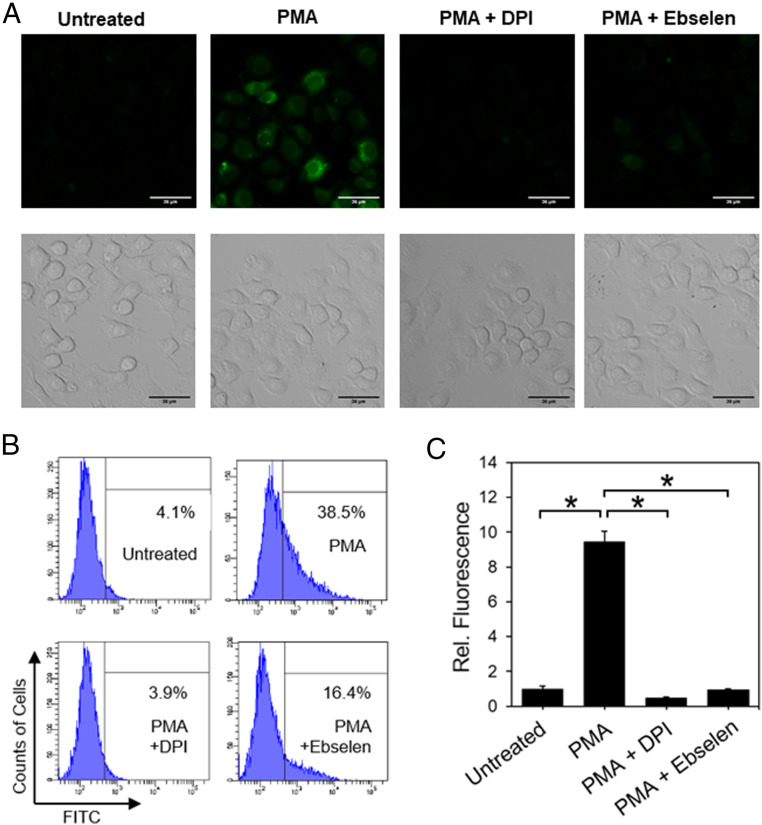
Fig. 4.
PG1-FM imaging of endogenous H2O2 generation in live RAW264.7 macrophage cells under inflammatory immune response conditions with PMA stimulation. (A) Confocal microscopy (Top) and brightfield (Bottom) images of RAW264.7 macrophages stained with PG1-FM (10 μM) and then treated with PMA (1 μg/mL) or vehicle control for 60 min, washed, and imaged or first pretreated with Nox inhibitor DPI (5 μM) or antioxidant ebselen (5 μM) for 30 min in HBSS solution (250 µL) before replacing the solutions in the wells with a mixture of PG1-FM and PMA in the presence of additional DPI (5 μM) or ebselen in HBSS (5 μM). (B) Flow cytometry histograms and (C) quantification of mean value fluorescence intensity using PG1-FM under same conditions as A. (Scale bar: 36 μm.) *P < 0.01.

