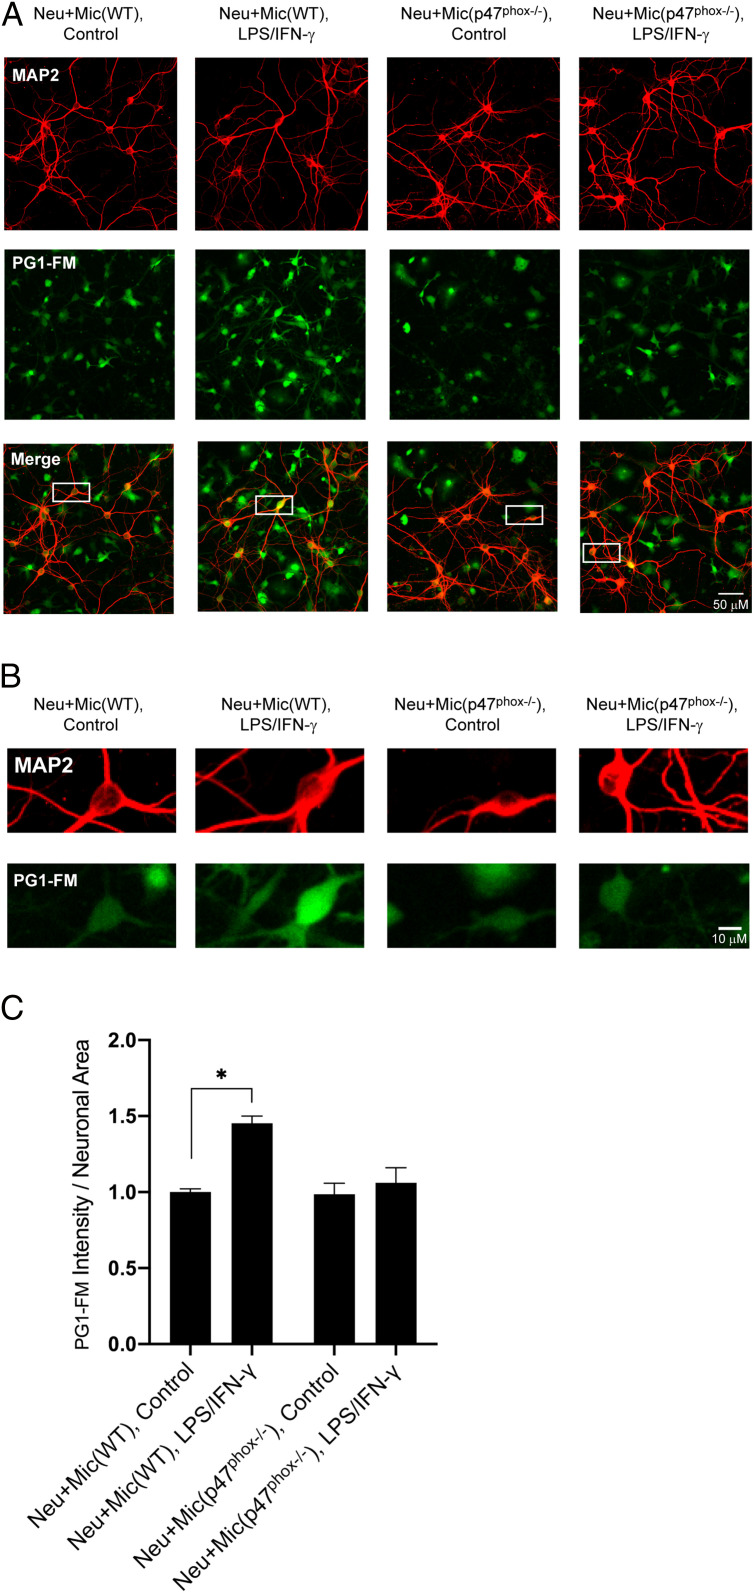
Fig. 6.
PG1-FM imaging of transcellular H2O2 signaling in neurons cultured with WT microglia and p47phox knockout microglia. (A) Representative images of neuron/microglia cocultures treated overnight with 500 ng/mL LPS + 50 ng/mL IFN-γ. Cultures were incubated with 10 μM PG1-FM (green) for 1 h and immunostained for the neuronal marker MAP2 (red). PG1-FM signal was increased in neurons cultured with WT microglia, but not in neurons cultured with p47phox−/− microglia. (Scale bar: 50 μm.) (B) Magnification of boxed areas in merged images in A. (Scale bar: 10 µM.) (C) Values plotted as PG1-FM fluorescence intensity within MAP2 positive area; mean ± SEM, normalized to the neuron/microglia (WT) control condition. n = 3, with 8 to 11 fields examined per repetition. Neu: neurons, Mic: microglia. *P < 0.05.

