Fig. 2.
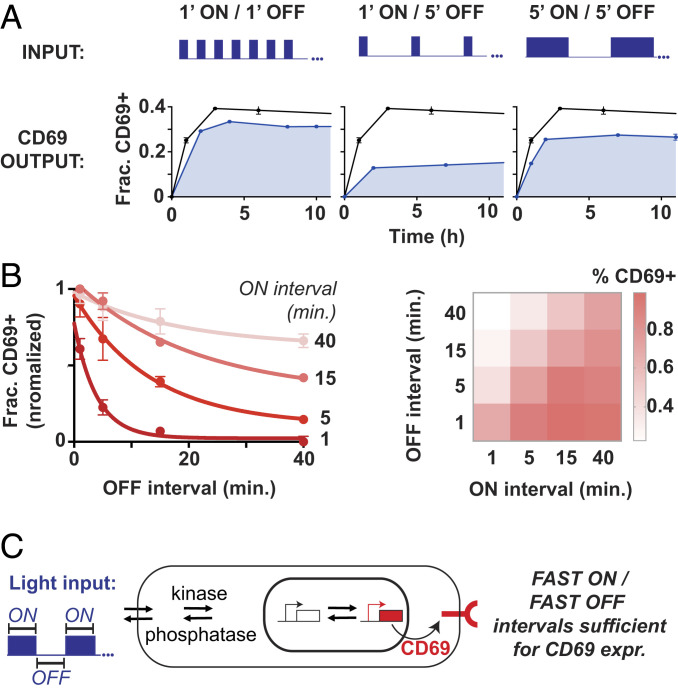
CD69 expression is sensitive to fast, minute-scale oscillations in T cell stimulus. (A) optoPlates were programmed with 1′ ON/1′ OFF, 1′ ON/5′ OFF, and 5′ ON/5′ OFF waveforms, and the fraction of CD69+ T cells was assessed over a 10.5-h period. Black lines indicate the CD69 response to constant illumination, and shaded blue lines indicate the CD69 response to oscillating illumination. (B) The fraction of CD69+ T cells after 10 h of stimulation is plotted as a function of OFF interval for ON intervals of 1, 5, 15, and 40 min. The same matrix of ON/OFF intervals is represented graphically in the heatmap at right. Error bars are SEM, n = 2 technical replicates. (A and B) Representative of three independent experiments and two donors. (C) Oscillating optogenetic inputs may drive reversible signaling and transcriptional transitions that lead to CD69 expression. Fast ON/fast OFF periods are sufficient for CD69 expression.

