Fig. 3.
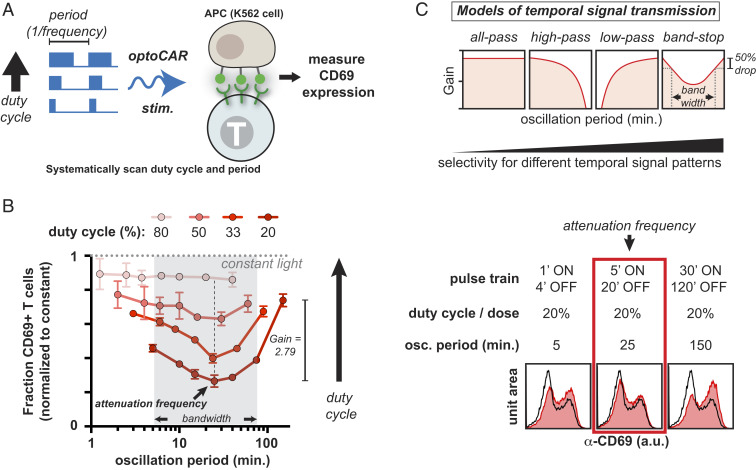
CD69 expression is a band-stop filter that is selectively attenuated at an oscillation period of ∼25 min. (A) optoPlates were programmed to systematically vary both the period (defined as 1/frequency) and duty cycle (the percentage of each period that the light is ON, from 1 to 100%) of blue light stimulation. optoCAR-expressing T cells cocultured with GFP+ K562 APCs were then stimulated with the programmed optoPlates for 22 h, and CD69 levels were assessed via flow cytometry. (B) The fraction of CD69+ T cells is plotted as a function of oscillation period and duty cycle, normalized to constant illumination. Trend lines indicate a single duty cycle. At constant duty cycles of 20, 33, and 50%, CD69 expression is attenuated at an oscillation period of ∼25 min, even though integrated input is constant. Bandwidth is calculated as the cutoff oscillation periods corresponding to an ∼50% drop in CD69 response. Gain is calculated as the ratio of CD69 response at the highest oscillation period versus at the attenuation frequency at a duty cycle of 20%. Error bars are SEM, n = 2 technical replicates. Representative of over seven independent experiments with CD4+ T cells derived from five healthy human donors. Histograms on the right represent raw data from which the plot at the left is derived. (C) Models of T cell signal transmission.

