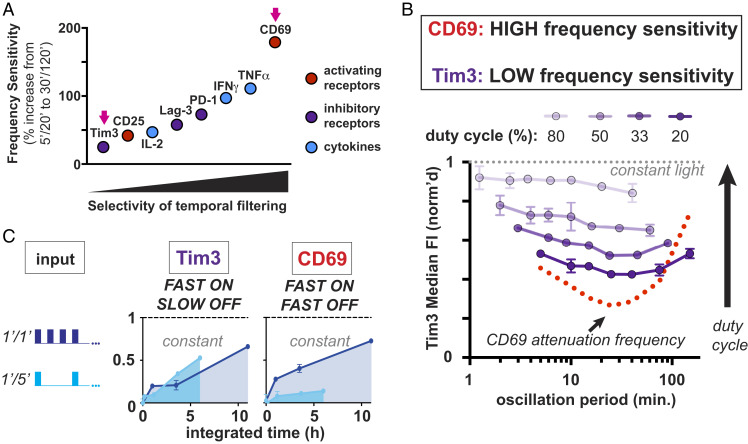
Fig. 4.
CD69 expression is a more selective temporal filter than other early T cell activation responses. (A) Gain is plotted for Tim3, CD25, IL-2, Lag-3, PD-1, IFNγ, TNFα, and CD69. Gain is calculated as the normalized response at the highest oscillation period divided by the normalized response at the attenuation frequency at a duty cycle of 20%. (B) Tim3 expression (in purple), which has the lowest gain value, has a relatively flat response to oscillation period at all duty cycles tested compared to CD69 (in red), which has the highest gain value. (C) Tim3 and CD69 expression are plotted in response to the integrated input of 1′/1′ and 1′/5′ pulse trains. Tim3 expression remains high in response to 5′ OFF intervals that do not stimulate CD69 expression. Error bars are SEM, n = 2 technical replicates; representative of at least three independent experiments and two donors.

