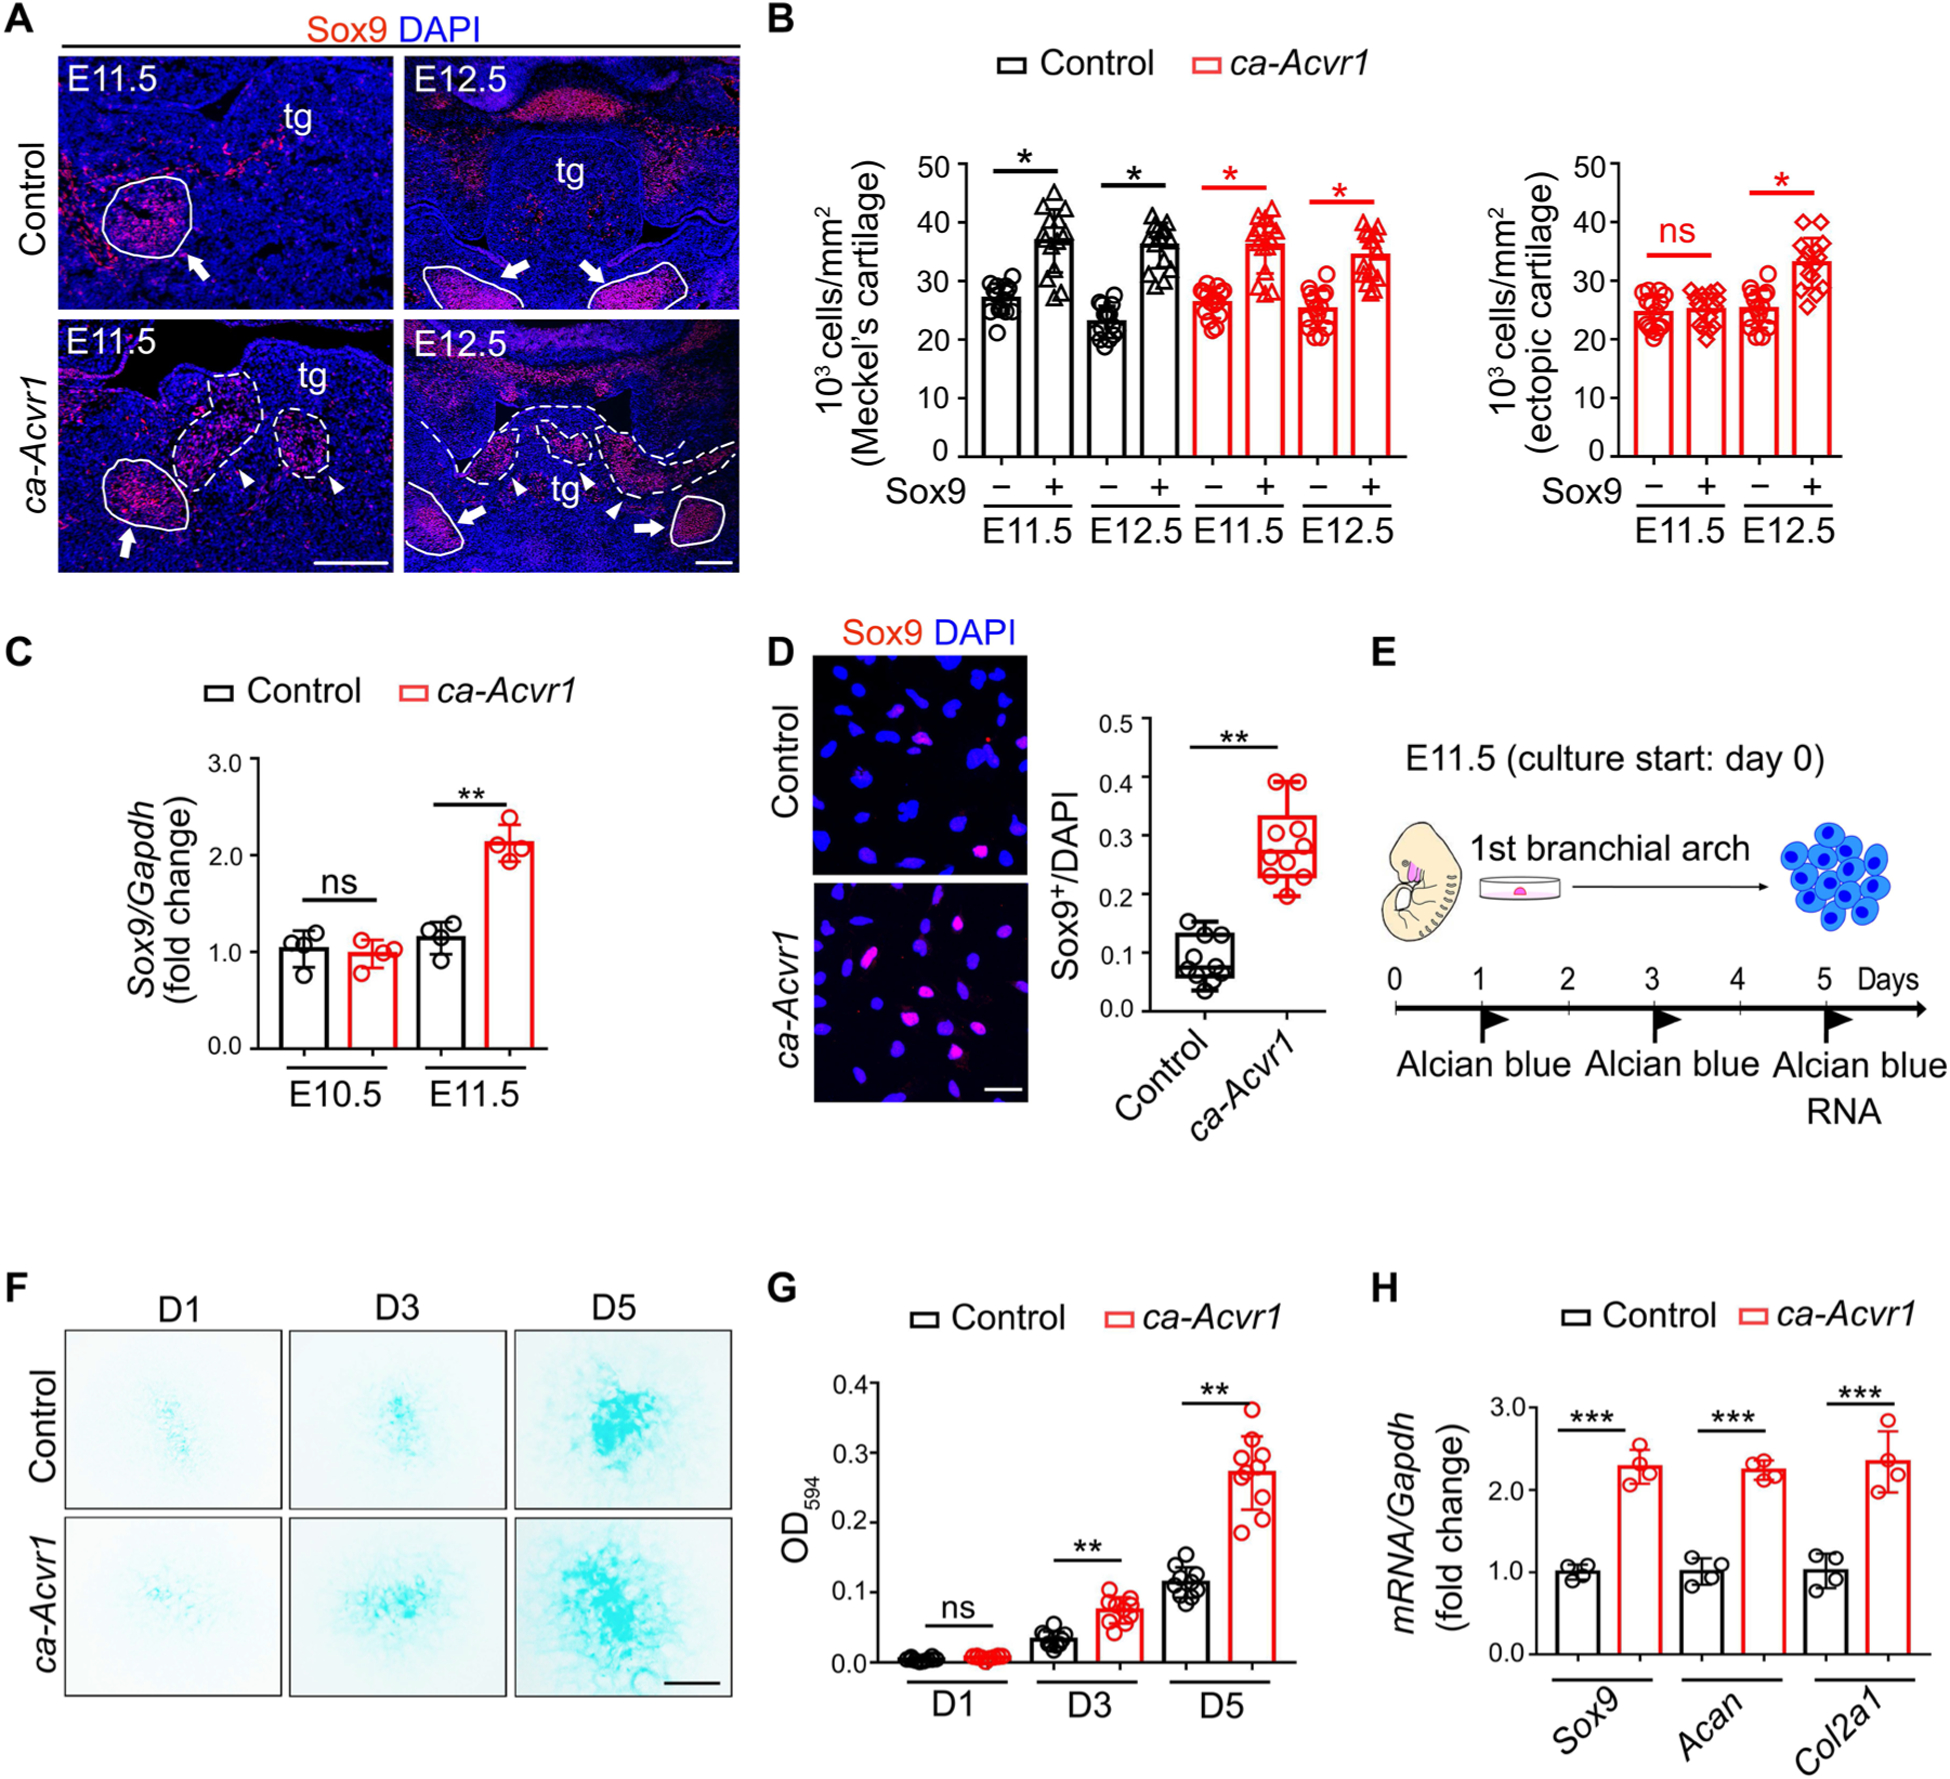
Fig. 2. Activation of BMP signaling causes the specification of CNCCs into an aberrant chondrogenic lineage.

(A) Sox9 (red) immunofluorescence of coronal head sections from control (ca-Acvr1+/+;P0-Cre) and mutant (ca-Acvr1flox/+;P0-Cre) embryos at the indicated stages. Scale bars, 100 μm. n = 5 mice per group. White arrowheads indicate ectopic cartilages, and white arrows indicate Meckel’s cartilages; tg, tongue. Nuclei are stained with DAPI (4′,6-diamidino-2-phenylindole; blue). (B) Condensation of cells in orthotopic (Meckel’s cartilage) and ectopic cartilages. The density of cells in each area was calculated from 5 embryos with three images (n = 5 embryos for each group). (C) Relative expression of Sox9 in the first branchial arch (BA1) tissues from control and mutant embryos at E10.5 and E11.5. n = 4 mice per group. (D) Immunostaining and quantification of Sox9 in CNCCs isolated from BA1 tissues (BA1 cells) of control or mutant embryos. Scale bar, 20 μm. n = 5 mice per group. (E) Schematic representation of micromass cell culture model used to determine chondrogenic capacity of BA1 cells. (F) Alcian blue staining of cells during 5-day micromass culture. Scale bar, 1 mm. n = 10 independent experiments. (G) Quantification of the optical density (OD at 594 nm) of the dye in (F). n = 10 independent experiments. (H) Relative expression of Sox9, Acan, and Col2a1 in control and mutant BA1 cells after 5 days in culture. n = 3 independent experiments. Error bars are means ± SD. ns, not significant; P > 0.05; *P < 0.05; **P < 0.01; ***P < 0.001; t test.
