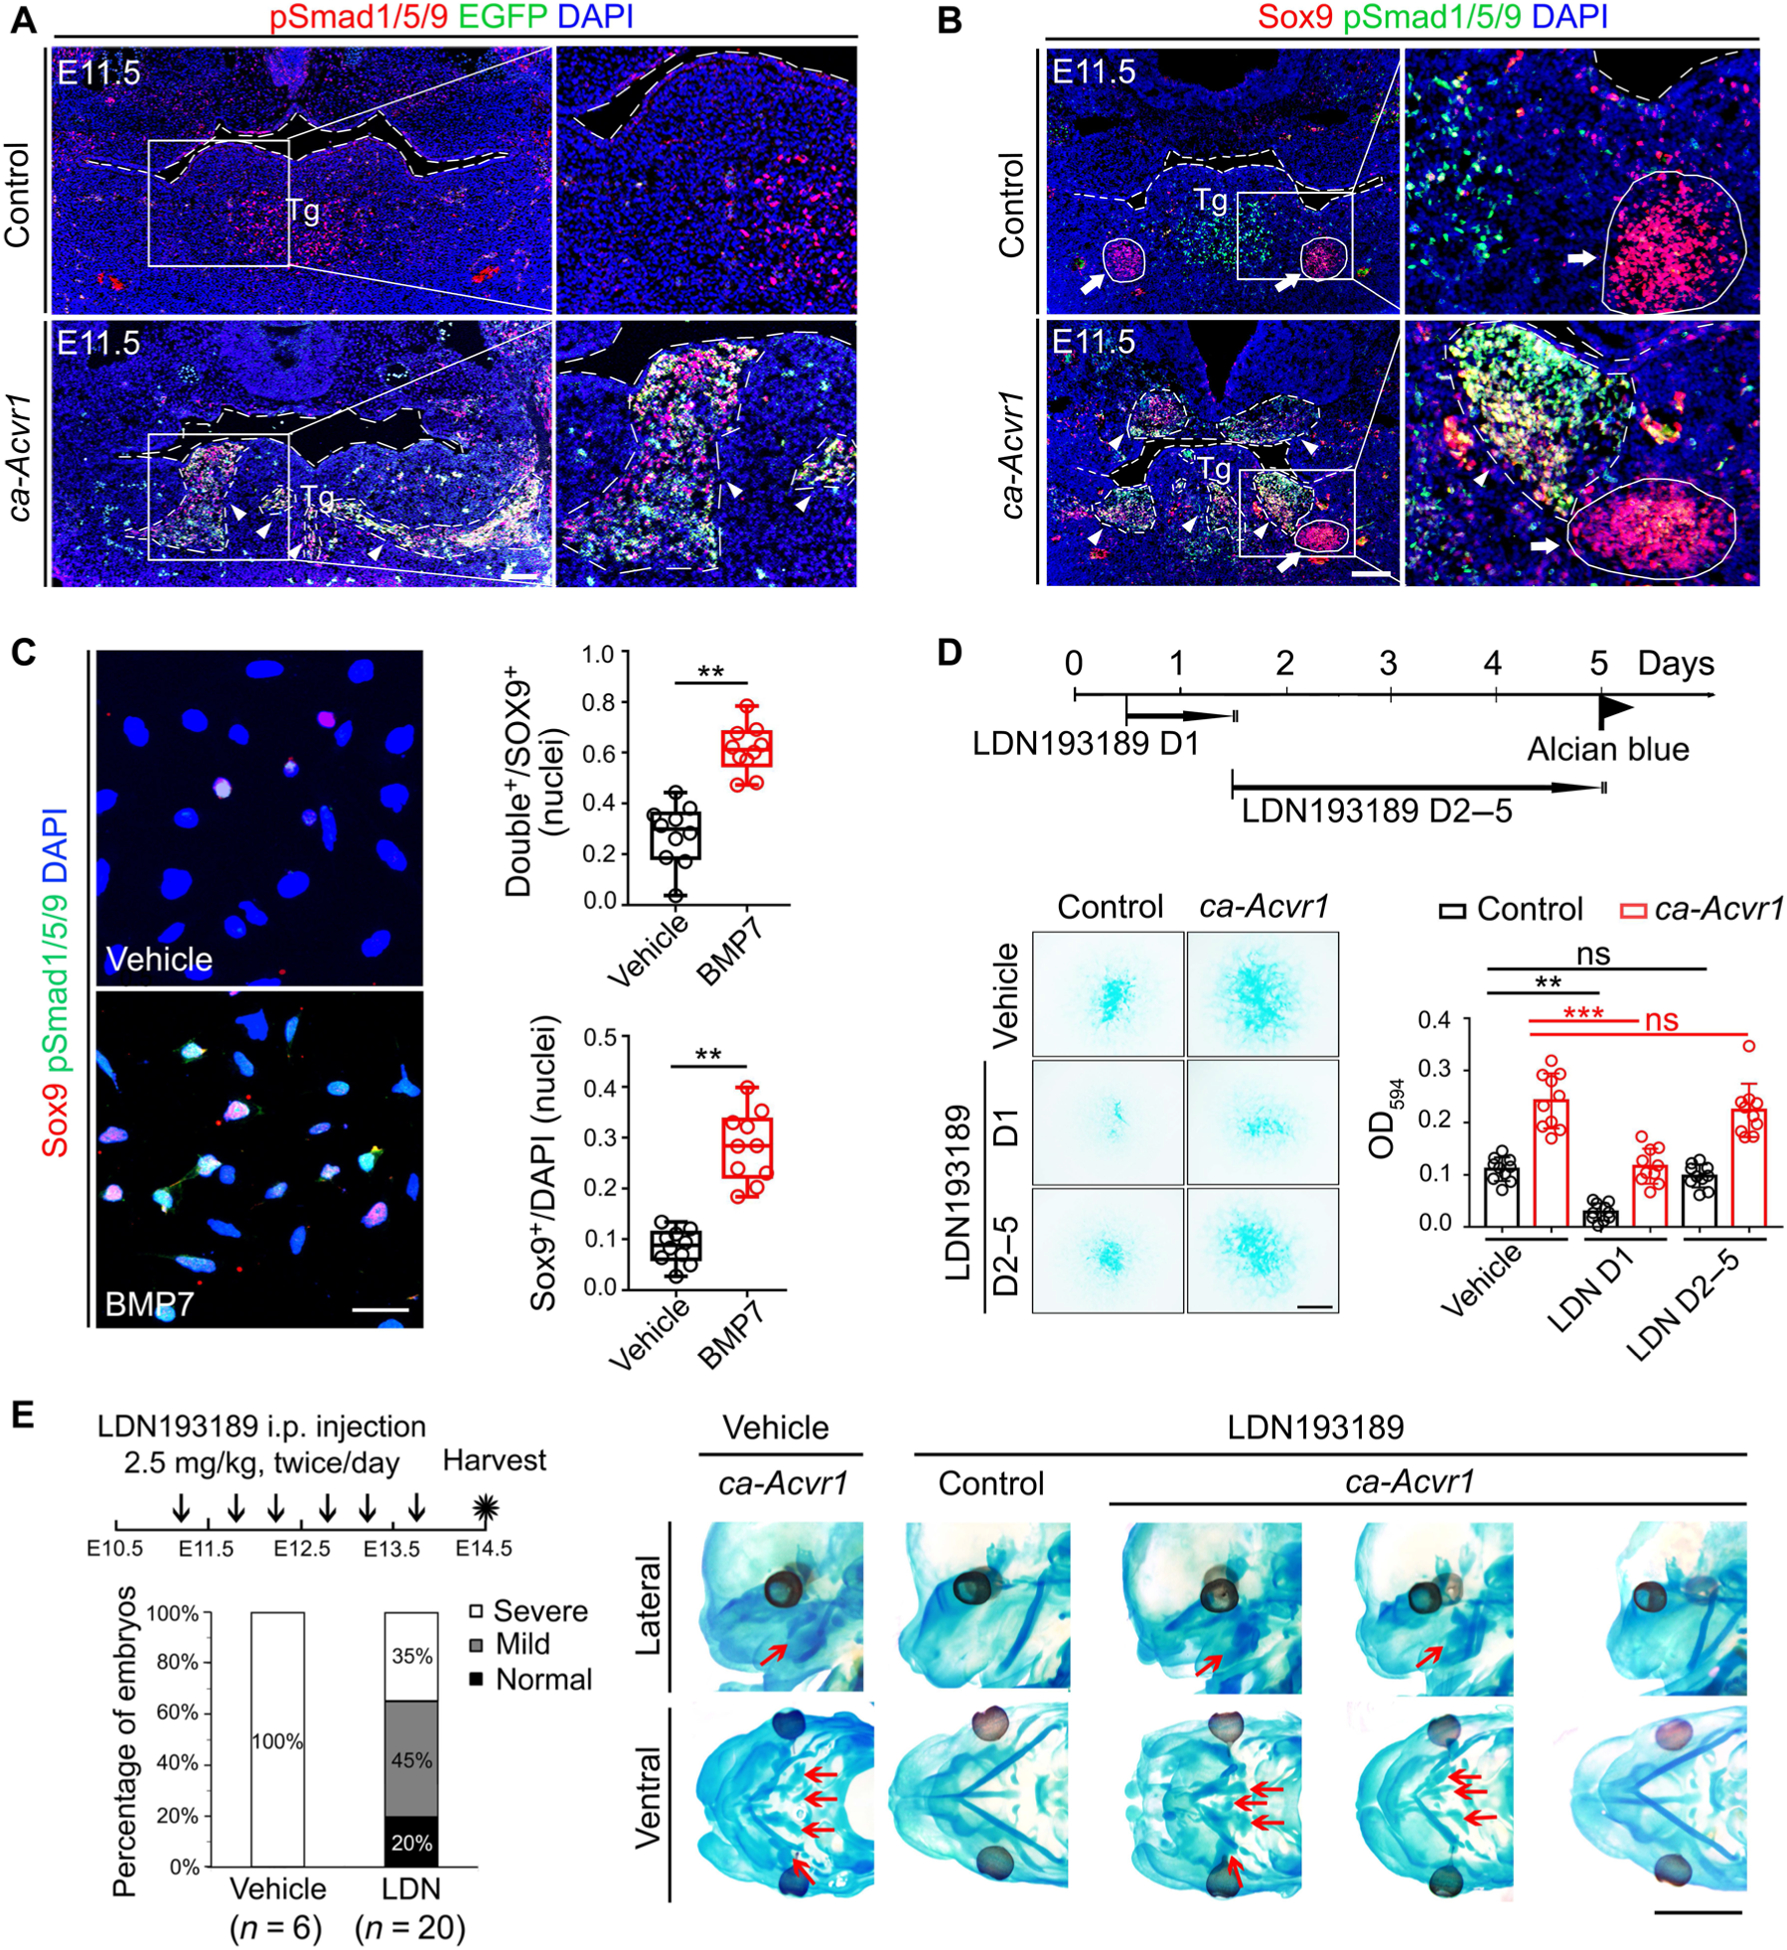
Fig. 3. Canonical BMP-Smad signaling is activated by ca-ACVR1 and commits CNCCs to the aberrant chondrogenic lineage.

(A and B) Double immunofluorescence of phosphorylated Smad1/5/9 (pSmad1/5/9; red) and the ca-Acvr1 transgene marker EGFP (green) (A) and Sox9 (red) and pSmad1/5/9 (green) (B) in coronal head sections from control (ca-Acvr1+/+;P0-Cre) and mutant (ca-Acvr1flox/+;P0-Cre) embryos at E11.5. Green signals in control are autofluorescent blood cells. White arrows indicate Meckel’s cartilages, and white arrowheads indicate ectopic cartilages. Scale bars, 100 μm. n = 6 mice per group. (C) Immunostaining and quantification of Sox9 (red) and pSmad1/5/9 (green) in BA1 cells from control embryos treated with or without BMP7. n = 5 independent experiments. (D) Experimental scheme, representative images of Alcian blue staining, and optical density quantification to assess chondrogenesis of BA1 cells stimulated with LDN193189 (LDN) at the indicated time. Scale bar, 1 mm. n = 10 independent experiments. (E) Experimental scheme for treating embryos in utero with the BMP signaling inhibitor LDN193189 or vehicle from E11.25 to E13.5, the ratios of each cartilage phenotype (severe, mild, and normal) in treated mutant embryos, and representative images showing the cartilage phenotypes in treated control and mutant embryos by Alcian blue staining. The numbers of mice examined are shown in parentheses. Red arrows indicate ectopic cartilages. Scale bar, 2 mm. Error bars are means ± SD. ns, not significant; P > 0.05; **P < 0.01; ***P < 0.001; t test (C); ANOVA (D). i.p., intraperitoneally.
