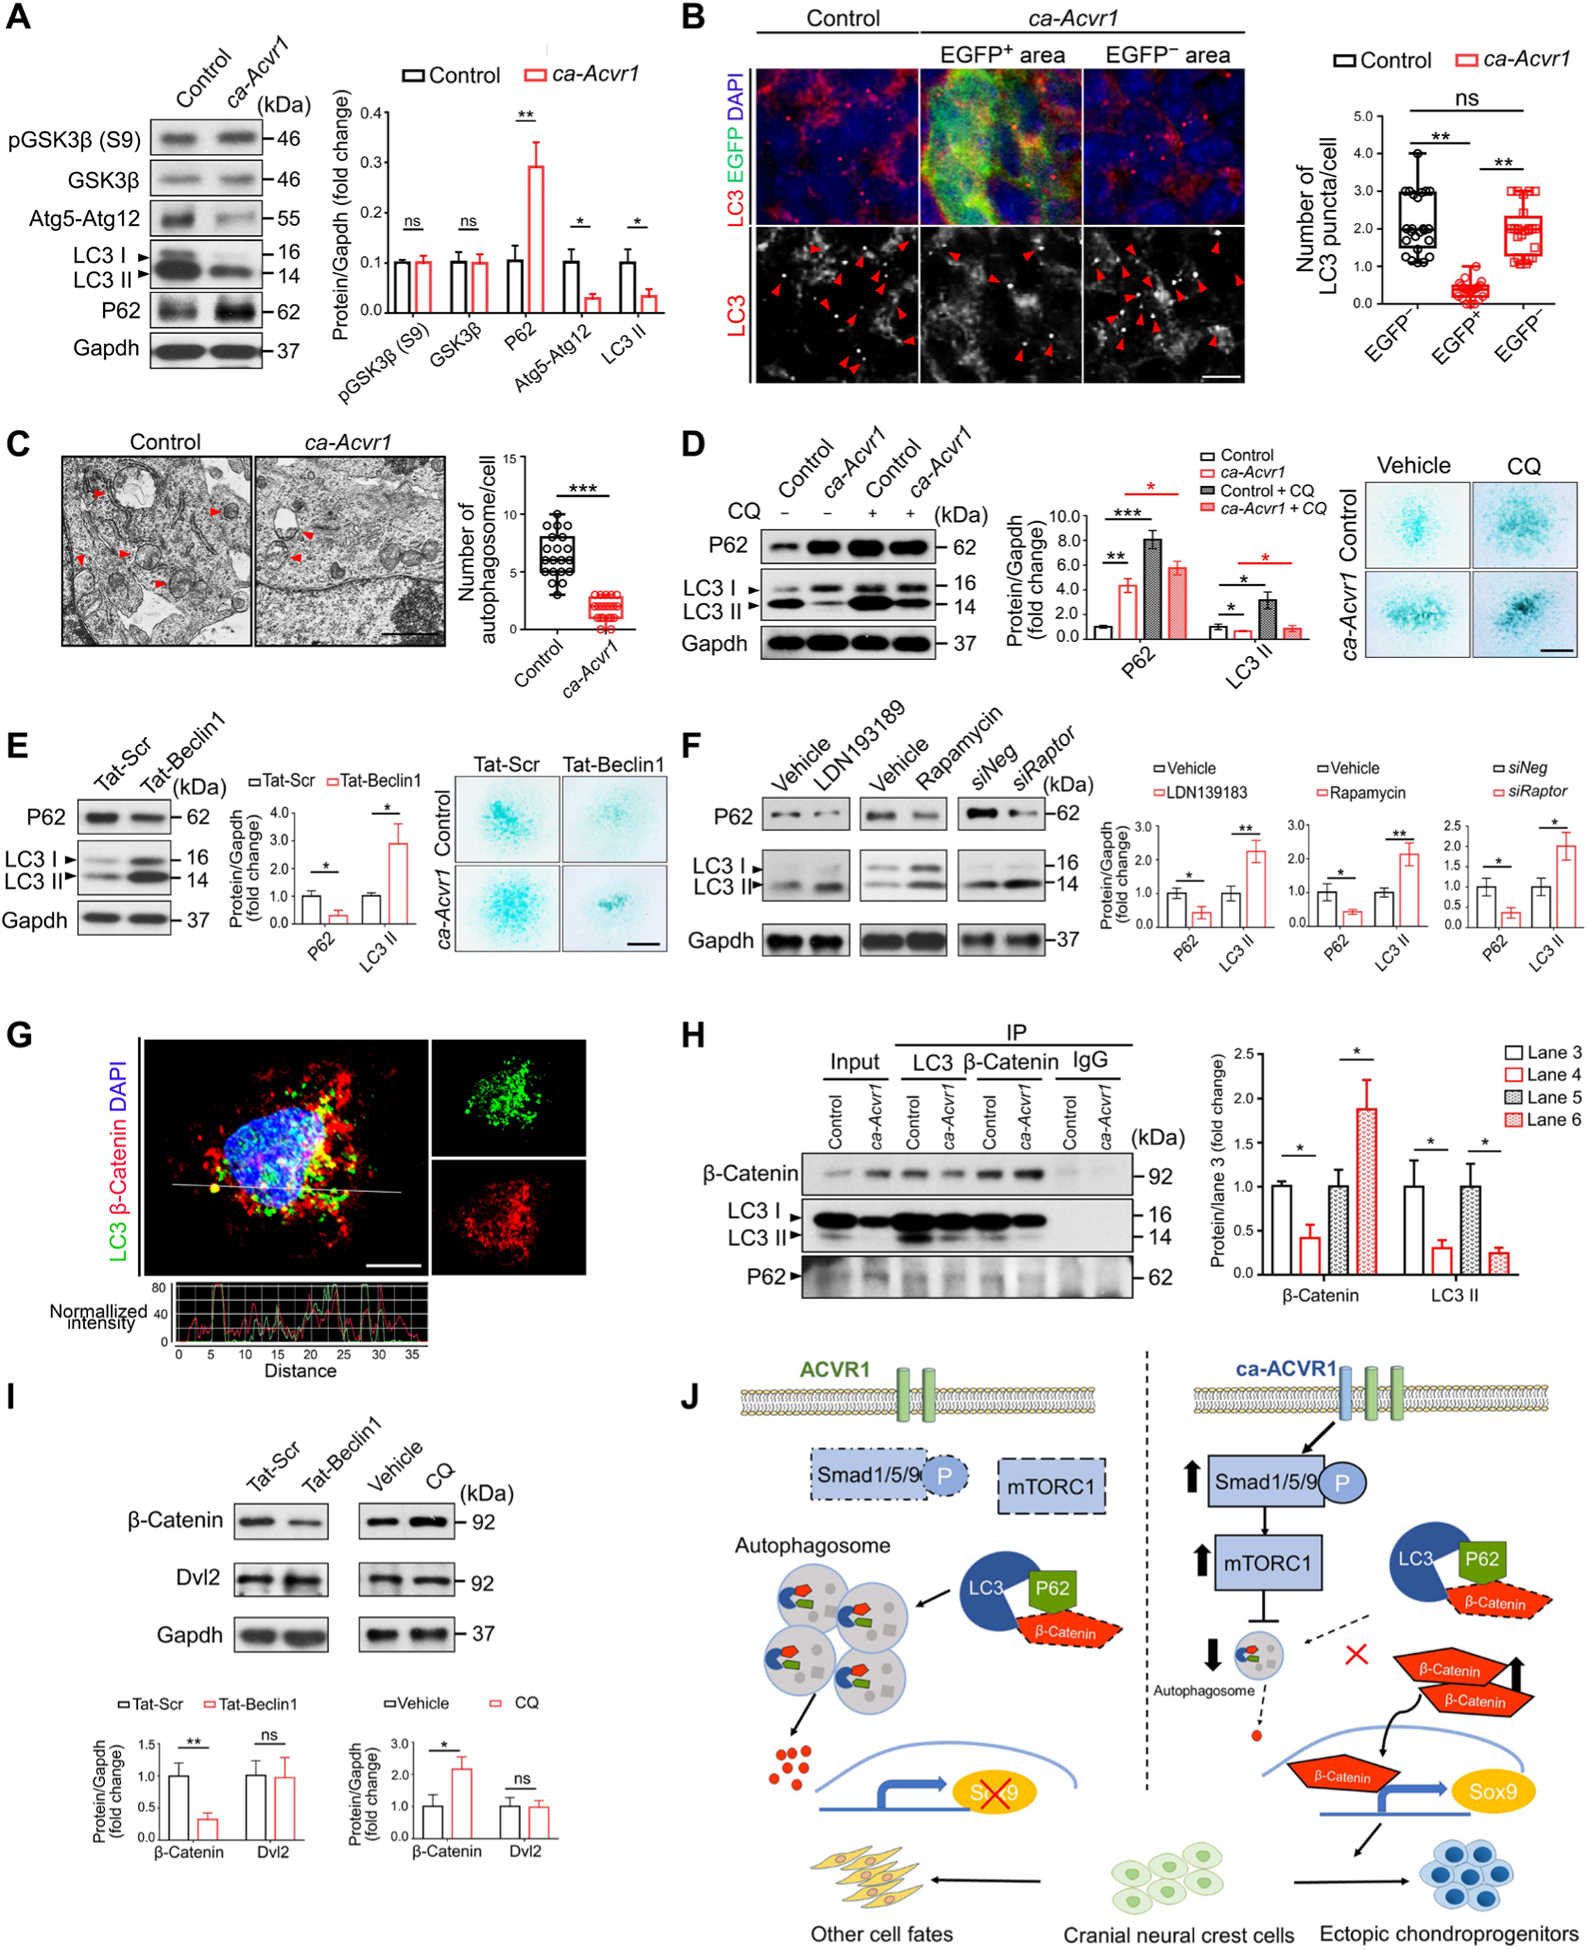
Fig. 6. Autophagy is suppressed in ca-Acvr1 mutants through mTORC1 signaling, and β-catenin is an autophagy target.

(A) Western blot analysis and quantification of GSK3β phosphorylated at Ser9 [pGSK3β (S9)], total GSK3β, the Atg5-Atg12 conjugate, LC3, and P62 in BA1 tissues. Gapdh is a loading control. n = 4 mice per group. (B) Double immunofluorescence for LC3 (red) and the ca-Acvr1 transgene marker EGFP (green) in coronal head sections from control and ca-Acvr1 mutant embryos at E11.5. Numbers of LC3 puncta (red arrowheads) per cell were quantified in EGFP-negative and EGFP-positive cells. Scale bar, 10 μm. n = 25 cells from four embryos per group. Schematic drawings illustrating the sources of the magnified regions are shown in fig. S9A. (C) Representative images and quantification of autophagic vacuoles (red arrowheads) per cell in the condensed area of the tongue from mutant embryos and its corresponding area from control embryos by transmission electron microscopy (TEM). Scale bar, 1 μm. n = 20 cells from three embryos per group. (D and E) Western blot analysis and quantification of P62 and LC3 in control and ca-Acvr1 BA1 cells treated with chloroquine (CQ) (D) and in control BA1 cells treated with Tat-Beclin 1 peptide (E) for 24 hours. n = 3 independent experiments. Representative images of Alcian blue staining to assess chondrogenesis of BA1 cells in each set of experiments are shown. Scale bars, 1 mm. n = 10 independent experiments. The optical density quantification of the dye is shown in fig. S9B. (F) Western blot and quantification of P62 and LC3 in BA1 cells treated with LDN193189, rapamycin, or siRaptor for 24 hours. n = 3 independent experiments. (G) Representative double immunofluorescence for LC3 (green) and β-catenin (red) in control BA1 cells with line scan analyses showing staining intensity of the indicated puncta. Scale bar, 10 μm. n = 5 independent experiments. (H) Immunoblotting and quantification of β-catenin, LC3, and P62 in LC3 and β-catenin immunoprecipitates (IP) from lysates from control and mutant BA1 cells. Immunoglobulin G (IgG) IP is a negative control. n = 3 independent experiments. (I) Western blot analysis and quantification of β-catenin and Dvl2 in mutant BA1 cells after stimulation with Tat-Beclin 1 peptide or CQ for 24 hours. n = 3 independent experiments. (J) Proposed model of enhanced BMP-Smad signaling in regulating CNCC fate. During normal development, there is a low level of pSmad1/5/9 and mTORC1 in CNCCs, and β-catenin is degraded by autophagy. When ca-ACVR1 is expressed in CNCCs, pSmad1/5/9-mTORC1 activity increases, which, in turn, inhibits autophagosome formation and autophagy-mediated β-catenin degradation. This increase in β-catenin signaling causes CNCCs to preferentially acquire ectopic chondrogenic fates. Uncropped Western blot images are shown in fig. S11. Error bars are means ± SD. ns, not significant P > 0.05; *P < 0.05; **P < 0.01; ***P < 0.001; t test [(A), (C), (E), (F), (H), and (I)]; ANOVA [(B) and (D)].
