
Figure 2.
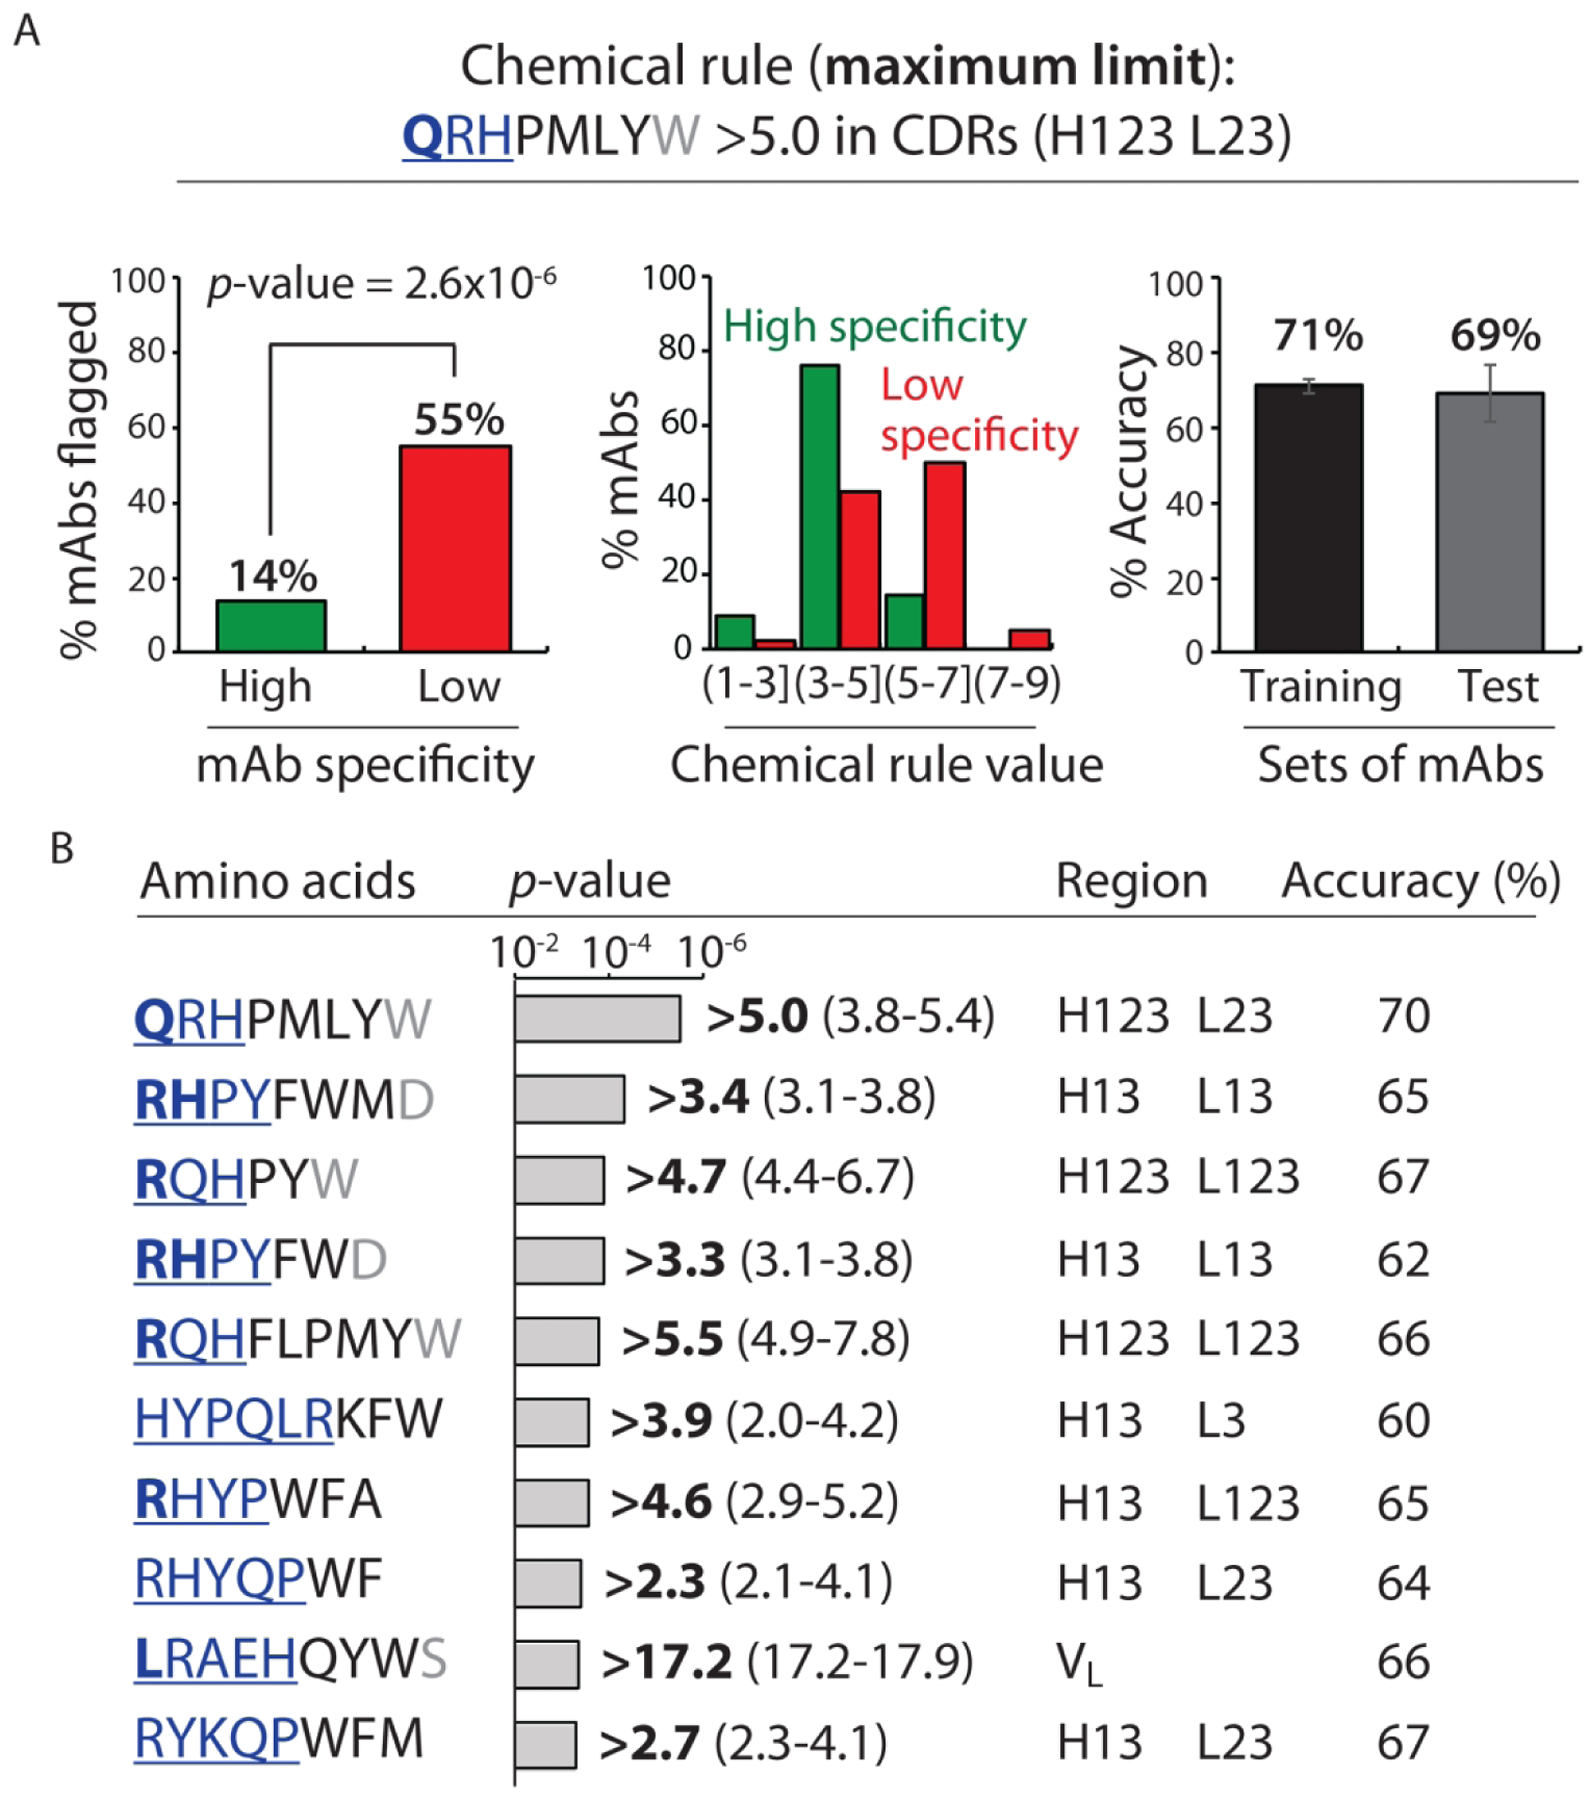
Chemical rules for selectively flagging mAbs with low specificity that limit the maximum allowable number of solvent-accessible residues in antibody variable regions. Each chemical rule is a maximum limit on the summed counts of different types of amino acids in the CDRs weighted by their relative solvent accessibilities. (A) Most selective maximum chemical rule for identifying mAbs with low specificity. mAbs with >5.0 Gln, Arg, His, Pro, Met, Leu, Tyr and Trp residues – weighted by their solvent exposures – in five CDRs (heavy chain 1, 2 and 3 and light chain 2 and 3) are flagged. On the left, the percentage of mAbs flagged with high and low specificity are reported for entire set (137 mAbs). In the middle, the distribution of the percentage of mAbs with ranges of chemical flag values are reported. On the right, the average adjusted accuracy of the chemical rule for flagging low specific antibodies relative to high specific ones is reported for the training and test sets. (B) Summary of the ten most selective chemical rules that limit the maximum sum of particular types of residues. The bolded value of each rule is the most statistically significant one when evaluated for the entire panel of clinical-stage mAbs, while the range of values reflect those that met the constraints used during cross validation. In (A) and (B), the contributions of the residues to each rule are reported in terms of their contributions to the differences in the observed rule values for mAbs with low specificity (40 clinical-stage mAbs) relative to those with high specificity (97 clinical-stage mAbs). The relative contributions of each amino acid are represented as bold and underlined blue font (most important, >30%), regular and underlined blue font (important, 10–30%), black font (minor importance, 0–10%) and grey font (least important, <0%). The negative contributions of some residues are due to the fact that the contributions are calculated for the entire set of clinical-stage mAbs (137 mAbs) and not only for those mAbs flagged by each rule. mAbs with low and high specificity are defined as described in Fig. 1. The p-values were calculated using a 2×2 contingency table (Fisher’s exact test), and the reported accuracies are adjusted to account for the different numbers of mAbs with high (97) and low (40) specificity. In (A), the average adjusted accuracies are calculated based on the training (80%) and test (20%) sets for each of the ten splits of the training and test sets. In (B), the adjusted accuracies are calculated for the entire set of 137 clinical-stage mAbs using the best flag values.