
Figure 5.
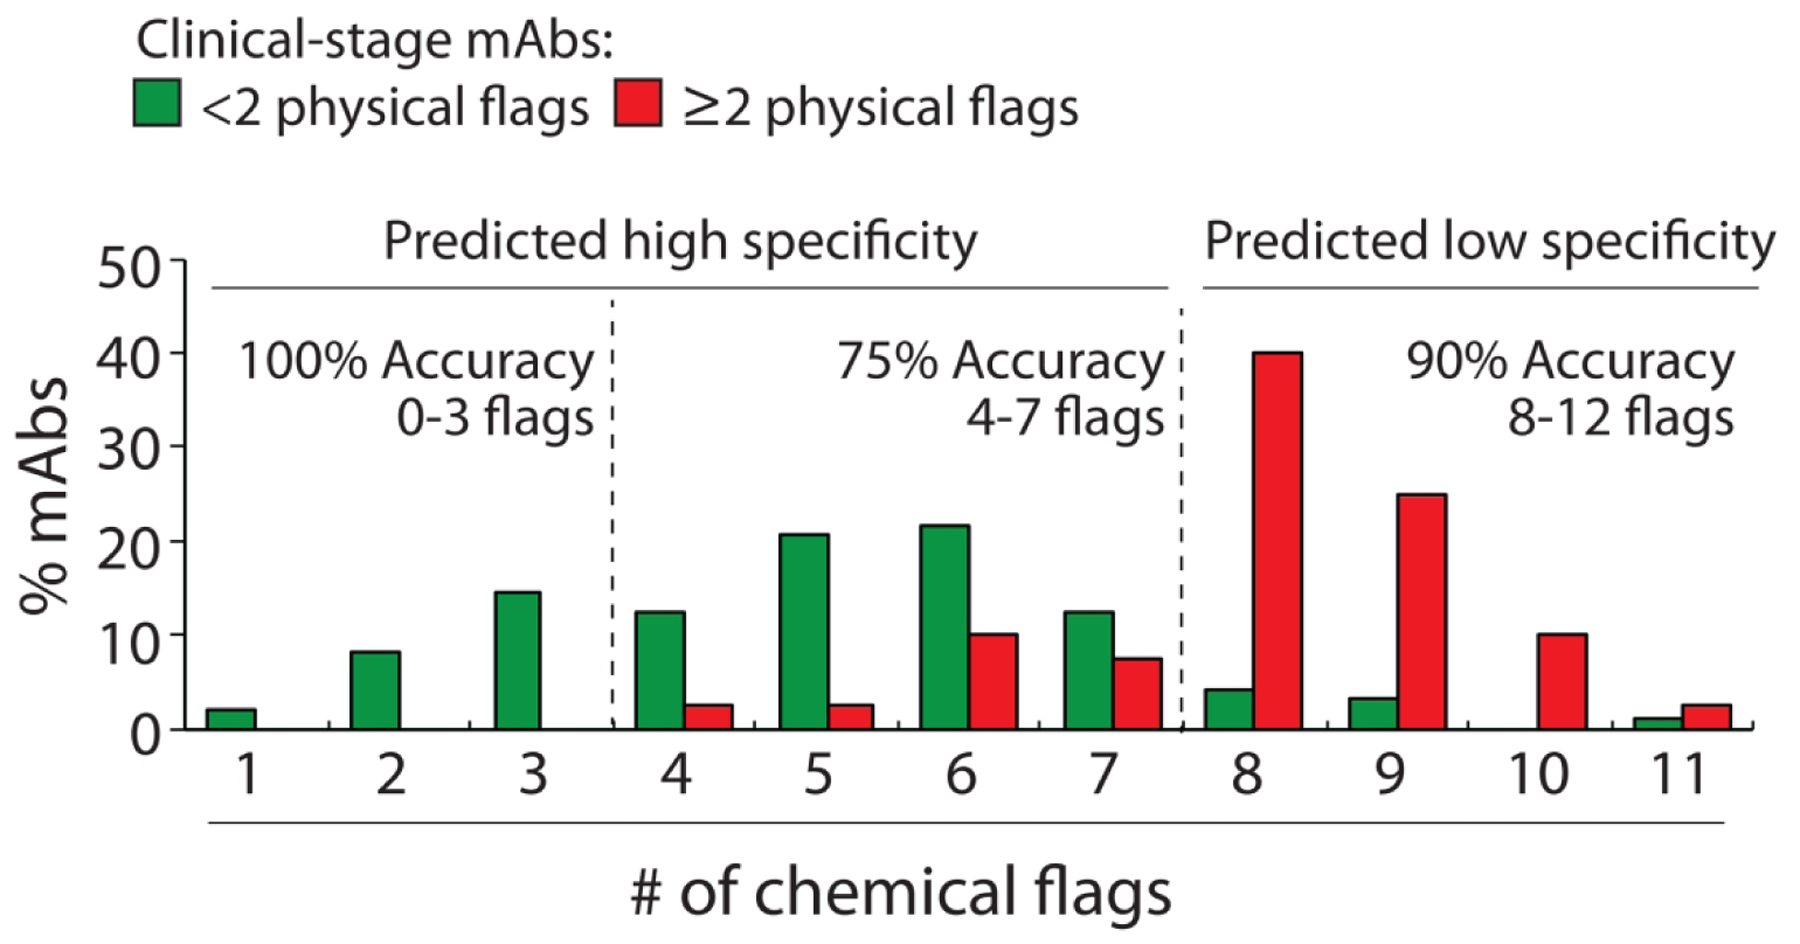
Distributions of the number of chemical flags for clinical-stage mAbs with high and low specificity. The chemical flags are defined in Fig. 4A. The experimentally determined antibody specificities – as judged by five measurements of non-specific and self-interactions – are defined as described in Fig. 1. mAbs with high specificity are those with <2 physical flags and mAbs with low specificity are those with ≥2 physical flags. The adjusted accuracies are calculated as described in Fig. 2.