Fig. 5.
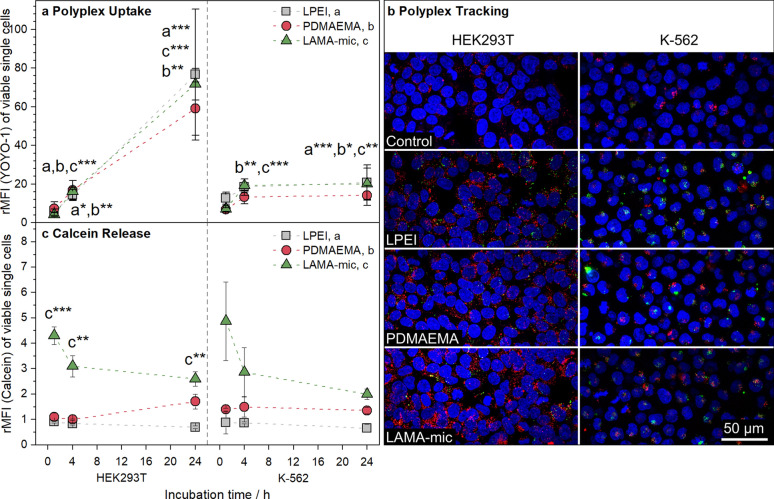
Investigation of the gene delivery process. a Cellular internalization of LAMA-mic polyplexes in different cell lines. Cells were incubated with polyplexes of polymers and YOYO-1-labeled pDNA at N*/P 30 and analyzed via flow cytometry. Cells incubated with labeled pDNA served as control (rMFI = 1). Values represent mean ± SD (n = 3). Asterisks indicate significant differences of LPEI (a), PDMAEMA (b), LAMA-mic (c) to the control of the respective time point. b Cellular internalization of polyplexes investigated via CLSM following incubation of cells with polyplexes of polymers and YOYO-1-labeled pDNA at N*/P 30 for 1 h (n ≥ 2). Endolysosomes were stained with LysoTrackerTM Red (red), nuclei were stained with Hoechst33342 (blue) and YOYO-1 fluorescence (green) was quenched with trypan blue. Maximum intensity projection was used to display polyplexes in every plane of the cell. c Endosomal escape of LAMA-mic polyplexes was detected by the non-permeable dye calcein and analyzed via flow cytometry relative to the calcein control (rMFI = 1). Values represent mean ± SD (n = 3). If not stated otherwise, asterisks indicate significant differences to the control of the respective time point. Since there was no significant interaction of incubation time and treatment for K-562 cells, the main effects of the treatment were determined with only LAMA-mic showing a significant difference to the control (p < 0.001)

