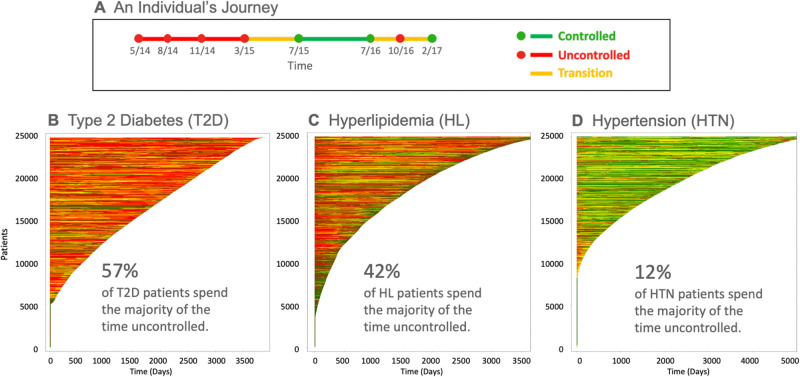
Figure 3.
Population of patient journeys for 3 chronic conditions. A) An individual patient’s journey. Green dots represent encounters at which the disease parameter (eg, HbA1c) is controlled. Red dots represent encounters at which the disease parameter is not controlled. Red lines connect 2 consecutive encounters with uncontrolled outcomes. Green lines connect 2 consecutive encounters with controlled outcomes. Yellow lines connect consecutive encounters with different outcomes (1 controlled and 1 uncontrolled). B, C, D) Journeys for 25 000 randomly selected type 2 diabetes, hyperlipidemia, and hypertension patients, respectively. The individual patient journeys are stacked vertically and sorted in descending order by the duration of the patient’s longitudinal observations (days).

