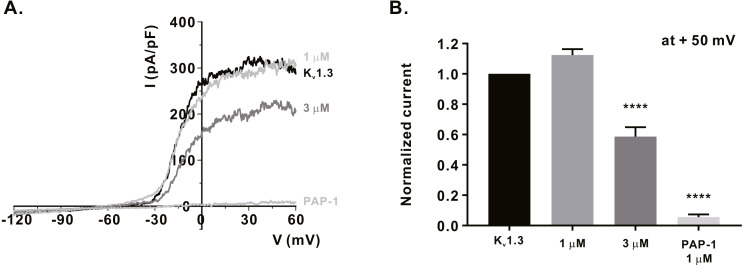
Figure 3. Inhibitory effects of α-mangostin on KV1.3 current (IKV) measured in Jurkat T cells.
(A) The representative current (I)-voltage (V) relationship curve showing the inhibition of IKV by α-mangostin (n £ 7). (B) Average value of current measured at +50 mV. Current without α-mangostin treatment and reduced current with α-mangostin treatment were compared. Data are expressed as the mean ± SEM. **** p < 0.0001.

