Figure 4.
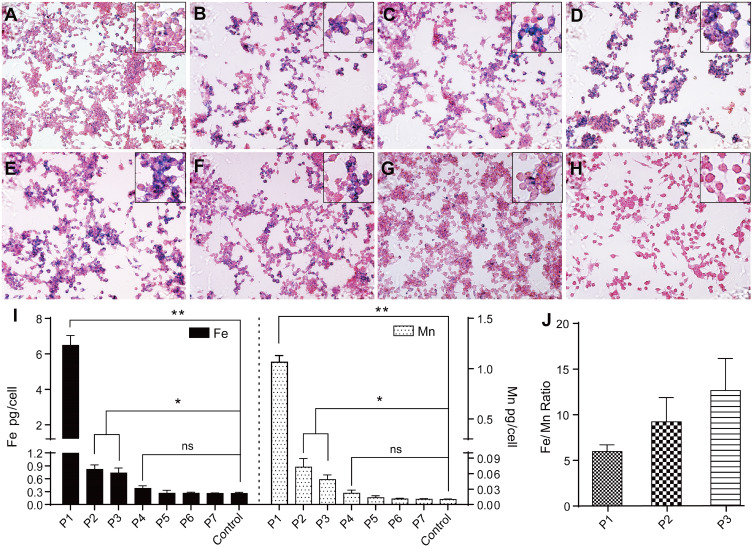
Prussian blue staining and ICP-OES measurement. (A–D) The prussian blue staining of cells incubated with 45, 90, 180 and 360 μM Mn-IONPs for 24 hours (×100). (E–H) The prussian blue staining of P1, P3, P5 and P7 cells (×100). Inset shows local enlarged image of panel (A–H). (I) Iron and manganese contents in control and P1-P7 cells detected by ICP-OES. (J) The molar ratio of Fe/Mn contents in the P1-P3 cells. *p < 0.05; **p <0.01; ns, not significant.

