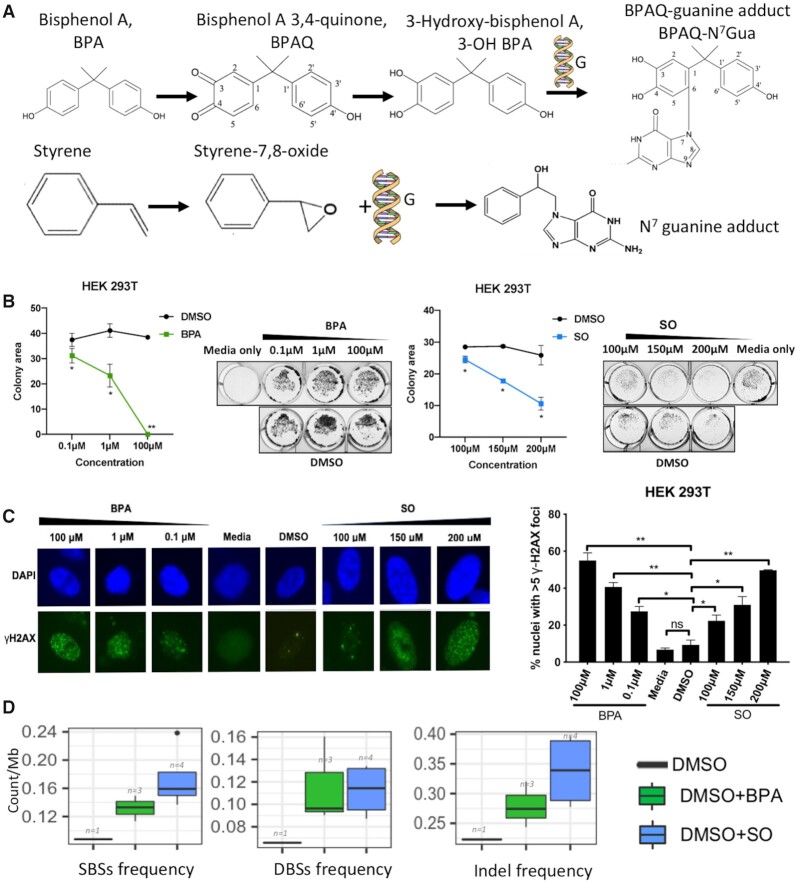
Figure 1.
(A) Chemical structures of BPA and SO, and their chemical reaction with guanine bases in DNA; (B) Colony formation assay using crystal violet staining shows the colonies present after treatment using different BPA (0.1, 1 and 100 μM) or SO (100, 150 and 200 μM) concentrations. Representative images show colony formation by HEK 293T cells under different concentrations of BPA and SO. Each BPA and SO treatment experiments were performed in replicates and repeated twice. DMSO of equivalent concentration was used as negative control. Data are quantified by ColonyArea as colony area percentage and represented as mean ± SEM. *P < 0.05, **P < 0.01; (C) γ-H2AX assay shows the DNA damage in HEK 293T cells exposed to different concentrations of BPA and SO, and negative controls with DMSO and media, low magnification images revealed by DAPI (blue) and γ-H2AX (green) immunostaining. Each experiment was performed in replicates and repeated twice, and two-tail t-test were performed. Error bar indicates SEM. *P < 0.05, **P < 0.01; (D) Frequency of acquired single base substitutions (SBS), double base substitutions (DBS), and small insertions and deletions (InDel) in the cells treated with BPA, SO and only DMSO (control).

