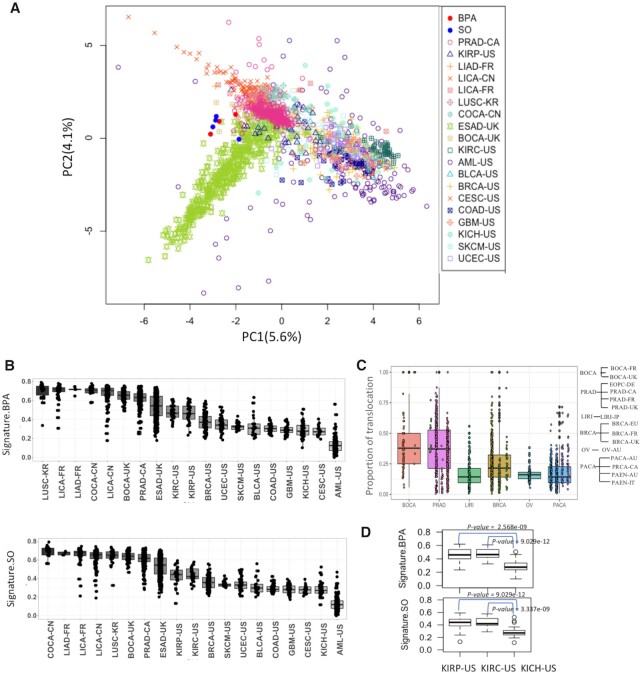
Figure 4.
(A) PCA plot shows variation among tumor samples from different cancer types and also BPA and SO-treated samples in terms of single nucleotide substitution frequency at 96 trinucleotide contexts; (B) Boxplot shows the weight of cosine similarity of BPA and SO mutation signatures in different cancer cohorts; (C) Proportion of translocations among all classes of structural variations in different cancer cohorts. The cohorts are grouped according to cancer type; (D) Boxplot shows the weight of BPA and SO mutation signatures in KIRP-US, KIRC-US and KICH-US. All abbreviations listed as Supplementary Table S3, P-values were calculated using Mann–Whitney U Test.

