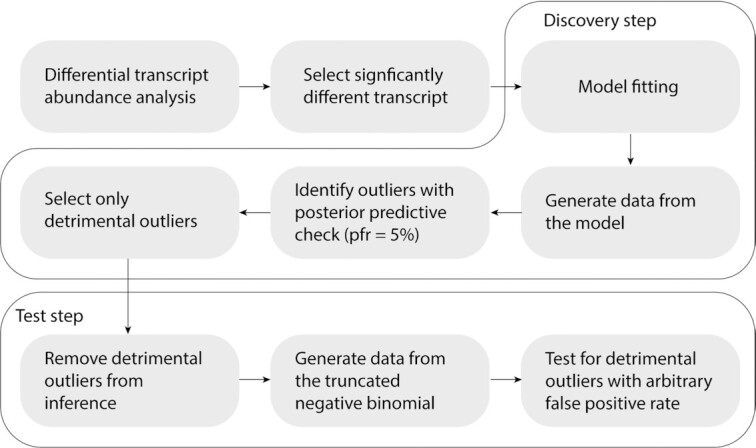
Figure 2.

Flow chart of the two-step strategy for outlier detection, including discovery and test steps. Because a model that includes outliers is ill-posed by definition, a first discovery step allows the flagging of potential outliers with relaxed criteria, while a second test step allows the evaluation of those potential outliers against a model fitted without them. The workflow includes a preliminary independent estimation of differential gene transcriptional abundance with methods such as edgeR (2) or DESeq2 (3). Genes which outliers will be selected from the significance rank. The first step of the outlier identification includes the fitting of the user-defined linear model on the user gene-selection. Then, the theoretical data distribution is generated from the join posterior, and genes are flagged as potential outliers with a default false positive rate threshold of 5%. Of those, only detrimental outliers (see ‘Materials and Methods’ section) are flagged. The test step includes the removal of possible detrimental outliers from the data, and the fit of the same model, compensating for data truncation. Then, the theoretical data distribution is generated from the join posterior and potential outliers are checked against, with a better calibrated false positive rate (0.01 by default).
