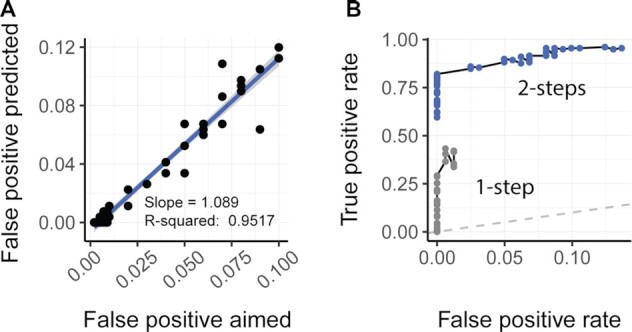
Figure 3.

Calibration and performances of the ppcseq algorithm. (A) Scatter plot showing good calibration of false positive rate, representing the linear association between the user defined false positive rate and the false positive rate that the model identified on a simulated dataset with no outliers. The statistics are relative to a linear interpolation of the data using the lm function in R. (B) Receiver operating characteristic (ROC) showing the performance of classification of transcript including outliers. The data points (blue) include only inference with the false positive aimed within a meaningful range for standard applications (from 0.002 to 0.1). For proving that the two-step-strategy (discovery and test) is highly beneficial for accurate outlier classification, for each two-step-strategy classification (blue points) the one-step-strategy counterpart is shown (grey points; obtained using theoretical data distribution from the first discovery step). The one-step-strategy (discovery only) shows lack in sensitivity, due to inflated variance of the inferred theoretical data distributions, driven by the presence of outliers.
