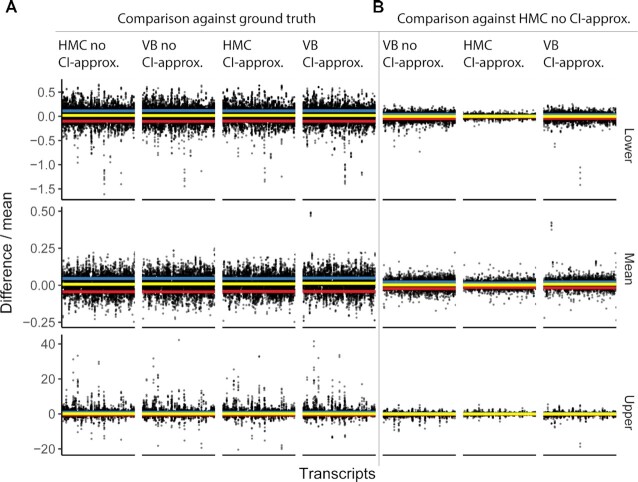
Figure 5.
Evidence that the use of both variational Bayes and credible interval (CI) approximation does not significantly affect the inference compared with the Hamiltonian Monte Carlo sampler. These tests were performed on simulated data from the joint posterior distribution fitted on real data (26) (see ‘Materials and Methods’ section). Each data point represents the inference for one gene. The y axis represents the scaled (by mean) difference of each method combination (specified in the header of the vertical facet strips) and the ground truth (specified in the panel headers). The three horizontal facet strips (lower, mean, and upper) include the inferred mean, and lower and upper quantiles (95% credible interval) of the theoretical data distributions. The yellow horizontal line corresponds to the median error, the blue and red lines correspond to the upper and lower standard deviation. (A) Comparison of the ground truth (simulated data) with (from left to right) Hamiltonian Monte Carlo sampling, variational Bayes, Hamiltonian Monte Carlo with credible interval approximation, and variational Bayes with credible interval approximation. (B) Comparison of the Hamiltonian Monte Carlo sampling (without any approximation) with variational Bayes (with and without credible interval approximation) and Hamiltonian Monte Carlo sampling with credible interval approximation.

