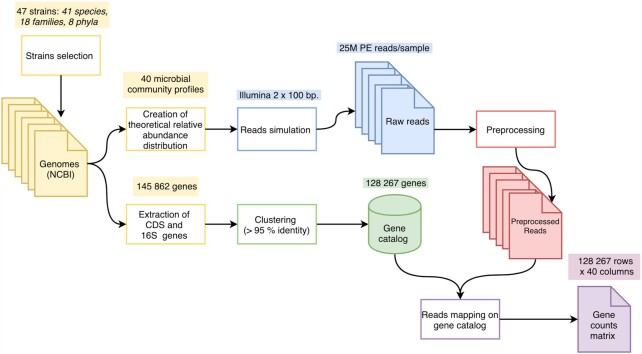
Figure 1.
Construction overview of the simulated gene catalog. Colors correspond to the different steps of the workflow: design of the 40 samples and of the gene catalog (yellow), creation of the non-redundant gene catalog (green), simulation of WMS reads for all the samples (blue), reads preprocessing (red) and reads mapping on the gene catalog (purple).

