Figure 2.
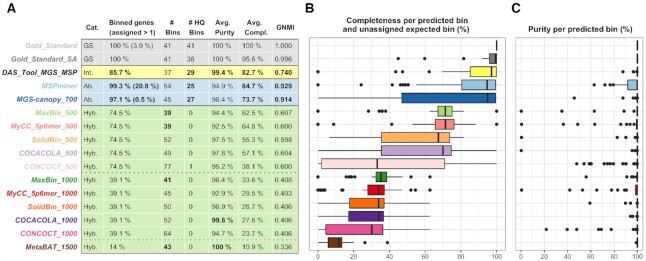
Overall results of the quality assessment metrics for each binner and used parameters. Panel (A) shows the computed quality assessment metrics. Binners are grouped and colored by category: gold standard (GS, gray), integrative (Int., yellow), abundance-based (Ab., blue), hybrid (Hyb., green). Continuous lines separate the categories and dashed lines divide the hybrid binners according to their value for the gene length filter (500, 1000 and 1500 bp). For each metric, the top three values are highlighted in bold. Zeros are not represented in the table for genes assigned more than once. Columns representing the number of bins and the number of HQ bins should be read together given that the number of bins does not necessarily represent distinct species. The GNMI score was computed between each binner and the gold standard. Panels (B and C) show the distribution of the completeness and the purity per bin. Two shades of the same color were used to represent a same binner with a different gene length threshold (e.g. green for maxbin). On panel (B), unassigned expected species-level bins are represented by a completeness of zero.

