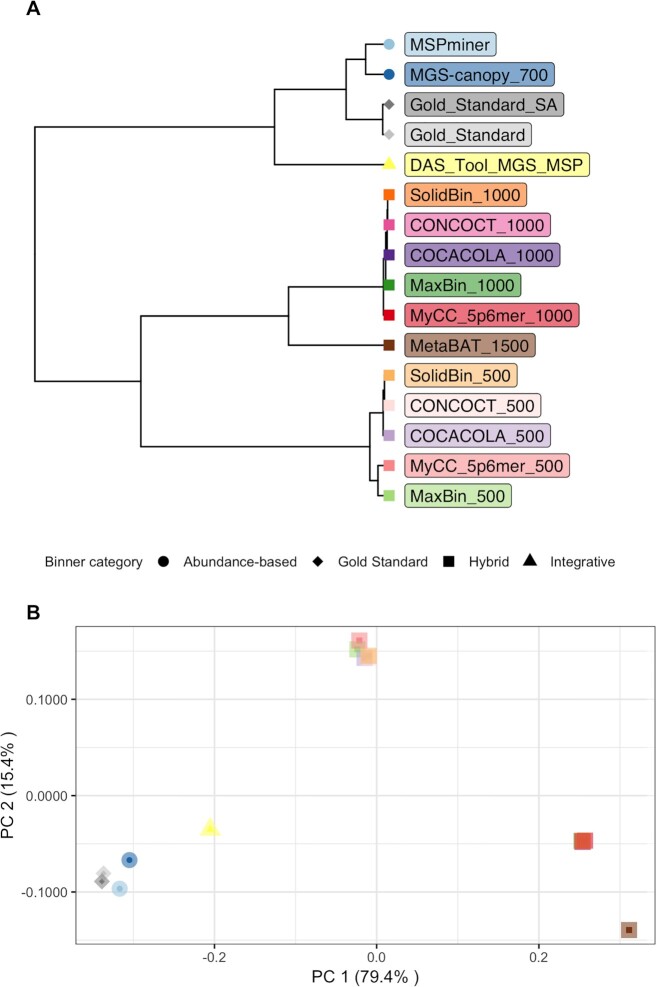
Figure 3.
Representation of the GNMI similarity metric between each pair of binners using a dendrogram and a principal coordinates analysis. Binners are represented by different shapes (binning category) and colors. Two shades of the same color were used to represent a given binner with a different gene length threshold (e.g. green for maxbin). Panel (A) is a dendrogram representation of the hierarchical clustering results based on GNMI values between pair of binners. These values were also used as input of a principal coordinates analysis which results are represented in panel (B).

