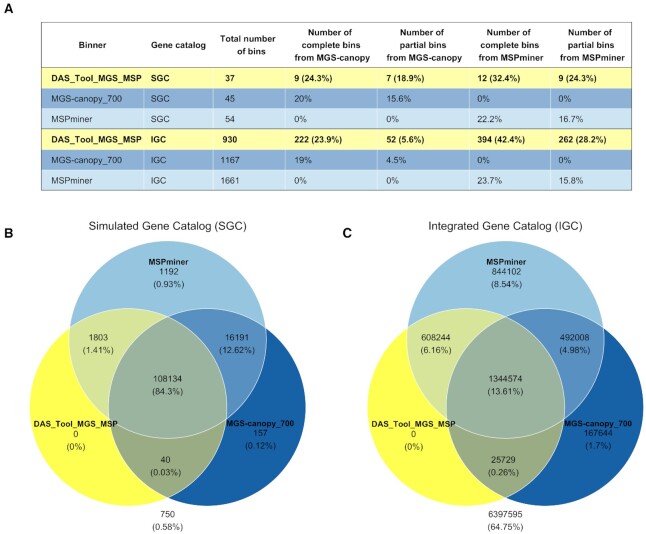
Figure 6.
Number of bins and proportion of binned genes between the SGC and the IGC. Panel (A) shows the results in terms of bins for the three binners when applied to the SGC and to the IGC. The third column represents the total number of bins recovered by each method and the four columns to its right describe a fraction of these bins. For instance, on the IGC, 222 bins recovered by das tool correspond to complete bins selected from the binning results of mgs-canopy. These 222 bins represent 23.9% of the bins of das tool and 19% of the bins of mgs-canopy. Panels (B and C) illustrate as Venn diagrams the genes binned by each binner on both catalogs (SGC and IGC). The values correspond either to the number or the proportion of assigned genes (100% being the total number of genes of the SGC or the IGC). The ones not in any circle indicate the unassigned genes.

