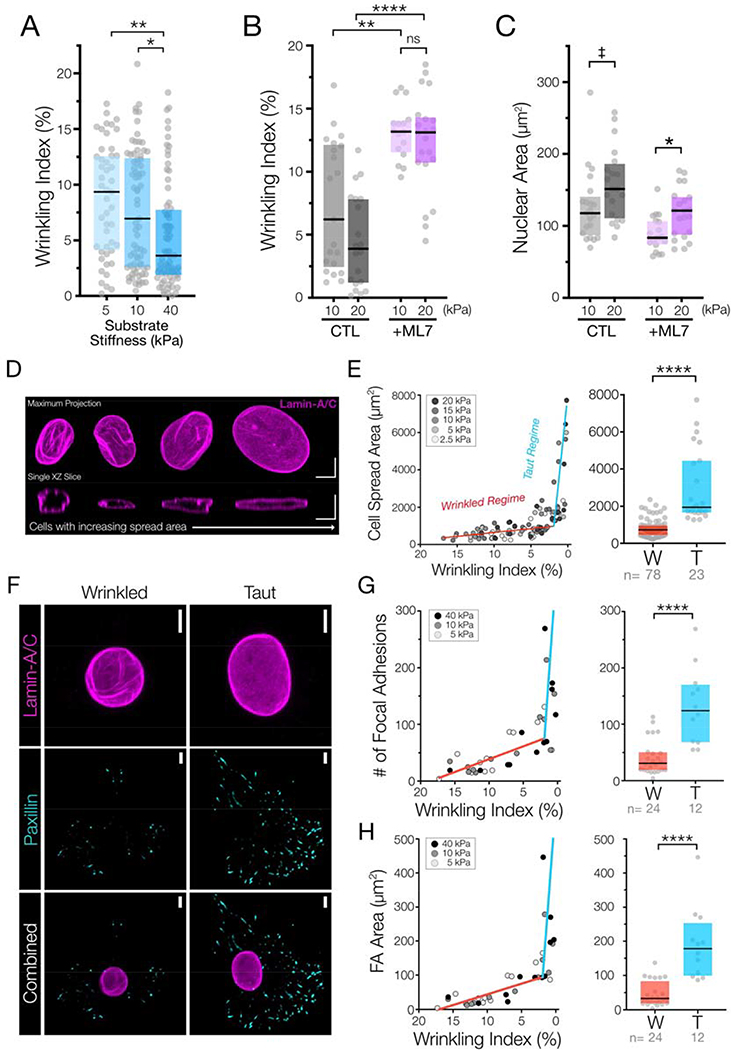
Figure #3 – Nuclear envelope wrinkling provides a strain energy sink for the contracting cytoskeleton.
(A) Wrinkling indices of MSCs cultured on three different stiffness MeHA hydrogels for 18 hours (n=47–73 nuclei, Box plot represents median and 25th/75th quartiles, * = p<0.05, ** = p<0.01, by Kruskal-Wallis one-way ANOVA testing with Dunn’s post-hoc). (B) Wrinkling indices and (C) nuclear projected areas of MSCs cultured on 10 or 20kPa hydrogels for 18 hours, followed by treatment with DMSO (“CTL”) or with ML7 for 60m prior to fixation and analysis (n=16–21 nuclei/group, Box plot represents median and 25th/75th quartiles, * = p<0.05, ** = p<0.01, **** = p<0.0001, ‡ indicates p=0.0693, by Kruskal-Wallis one-way ANOVA testing with Dunn’s post-hoc). Wrinkling data for 10 kPa hydrogel perturbations is also represented in the previous figure. (D) Representative XY and corresponding XZ sections of the nuclear lamina from multiple MSCs with increasingly higher cell spread areas suggests that increased contractile energy removes wrinkles from the nuclear envelope along with nuclear flattening and wrinkle unfurling as the nuclei become taut. SB = 5 μm. (E) (left) Plots of wrinkling index (shown from high to low) versus cell spread areas of MSCs cultured on five stiffness conditions with moduli ranging from 2.5 – 20 kPa for 18 hours (n= 101 nuclei over 5 stiffness conditions). Bilinear fit lines represent the “wrinkled regime” (W, red) or a “taut regime” (T, blue) and (right) re-plots of this wrinkling index vs. cell spread area data that are categorically separated using this bilinear fit. Box plot represents median and 25th/75th quartiles. (n=23 or 78 cells/group, **** = p<0.0001 by Mann-Whitney U-test). (F) Representative max projection images of lamin-A/C and paxillin of wrinkled and taut nuclei in MSCs cultured on 10 kPa hydrogels for 18 hours. SB = 5 μm. (G) (left) Plots of wrinkling index (from high to low) versus number of focal adhesions and (H) (left) total focal adhesion area per cell from MSCs cultured on three different HA hydrogel stiffnesses for 18 hours (n= 36 cells). Bilinear fit lines represent the “wrinkled regime” (W, red) or a “taut regime ” (T, blue) and re-plots of the wrinkling index vs. number of focal adhesions (G)(right) or wrinkling index vs. focal adhesion area data (H)(right) that are categorically separated using this bilinear fit. Box plot represents median and 25th/75th quartiles. (n=12 or 24 cells/group, **** = p<0.0001 by Mann-Whitney U-test).

