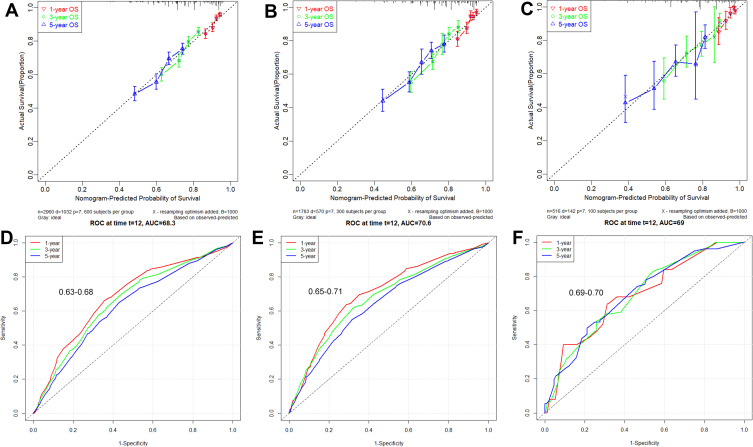
Figure 2.
The calibration and performance of SNIG model in the 3 datasets. Calibration curves for predicting patient OS at each time point in the (A) training set, (B) internal validation set, and (C) external validation set, respectively. Model-predicted OS is plotted on the x-axis, and actual OS is plotted on the y-axis. A plot along the 45-degree line (dotted blue line) would indicate a perfect calibration model in which the predicted probabilities are identical to the actual outcomes. ROC curves for OS probability in the (D) training set, (E) internal validation set, and (F) external validation set, respectively.
Abbreviations: SNIG, abbreviation of the incorporated variables – size, number, MVI, and grade; OS, overall survival; ROC, receiver operating characteristic curve.

