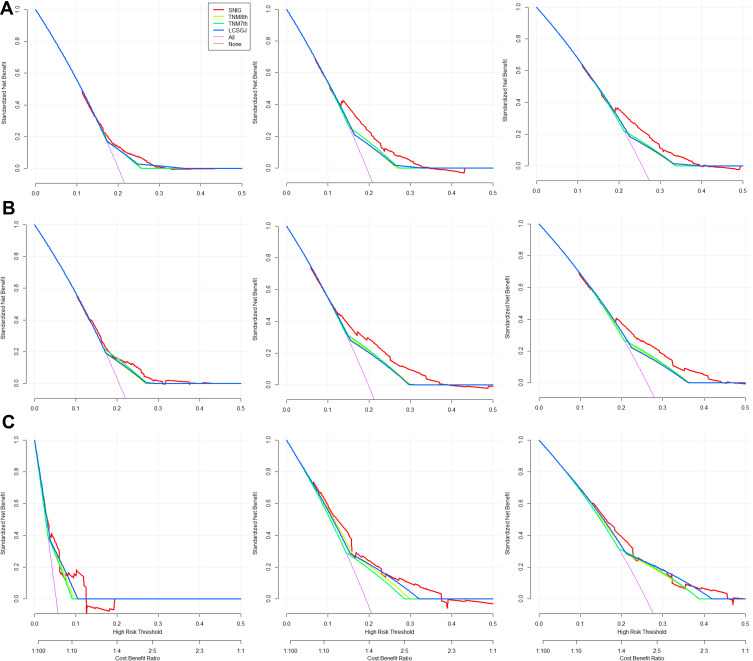
Figure 3.
DCA curves of the SNIG model at each time point in the (A) training set, (B) internal validation set, and (C) external validation set, respectively. The net benefits (y-axis) as calculated and it showed that nomogram model results in marginally outperforming between thresholds of 0.20 and 0.40 for prediction of OS.
Abbreviations: DCA, decision curve analysis; OS, overall survival.

