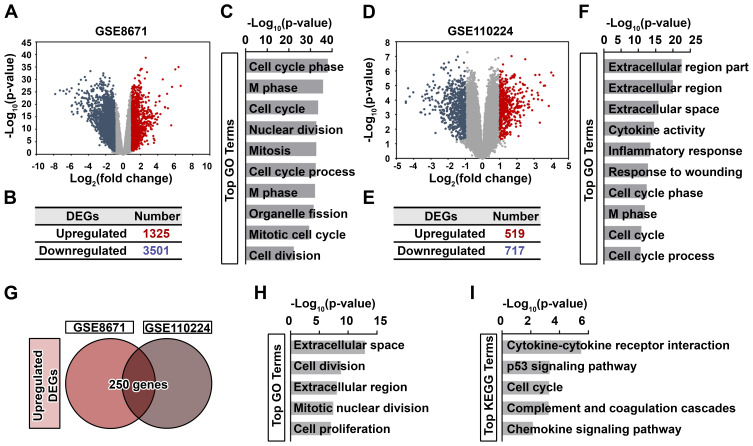
Figure 1.
Generation and functional analysis of DEGs upregulated in CRC. Volcano plot (A) and the distribution (B) of DEGs in CRC tissues based on GSE8671 dataset. Red dots, significantly upregulated DEGs; blue dots, significantly downregulated DEGs; gray dots, no significant difference. P < 0.05 and fold change > 2 were considered as significant. (C) Top 10 enriched GO terms of significantly upregulated DEGs are indicated. Volcano plot (D) and the distribution (E) of DEGs in CRC tissues based on GSE110224 dataset. Red dots, significantly upregulated DEGs; blue dots, significantly downregulated DEGs; gray dots, no significant difference. P < 0.05 and fold change > 2 were considered as significant. (F) Top 10 enriched GO terms of significantly upregulated DEGs are indicated. (G) Venn diagram of significantly upregulated DEGs between GSE8671 and GSE110224 datasets. Top 5 enriched GO terms (H) and KEGG pathways (I) of these 250 genes are indicated.

