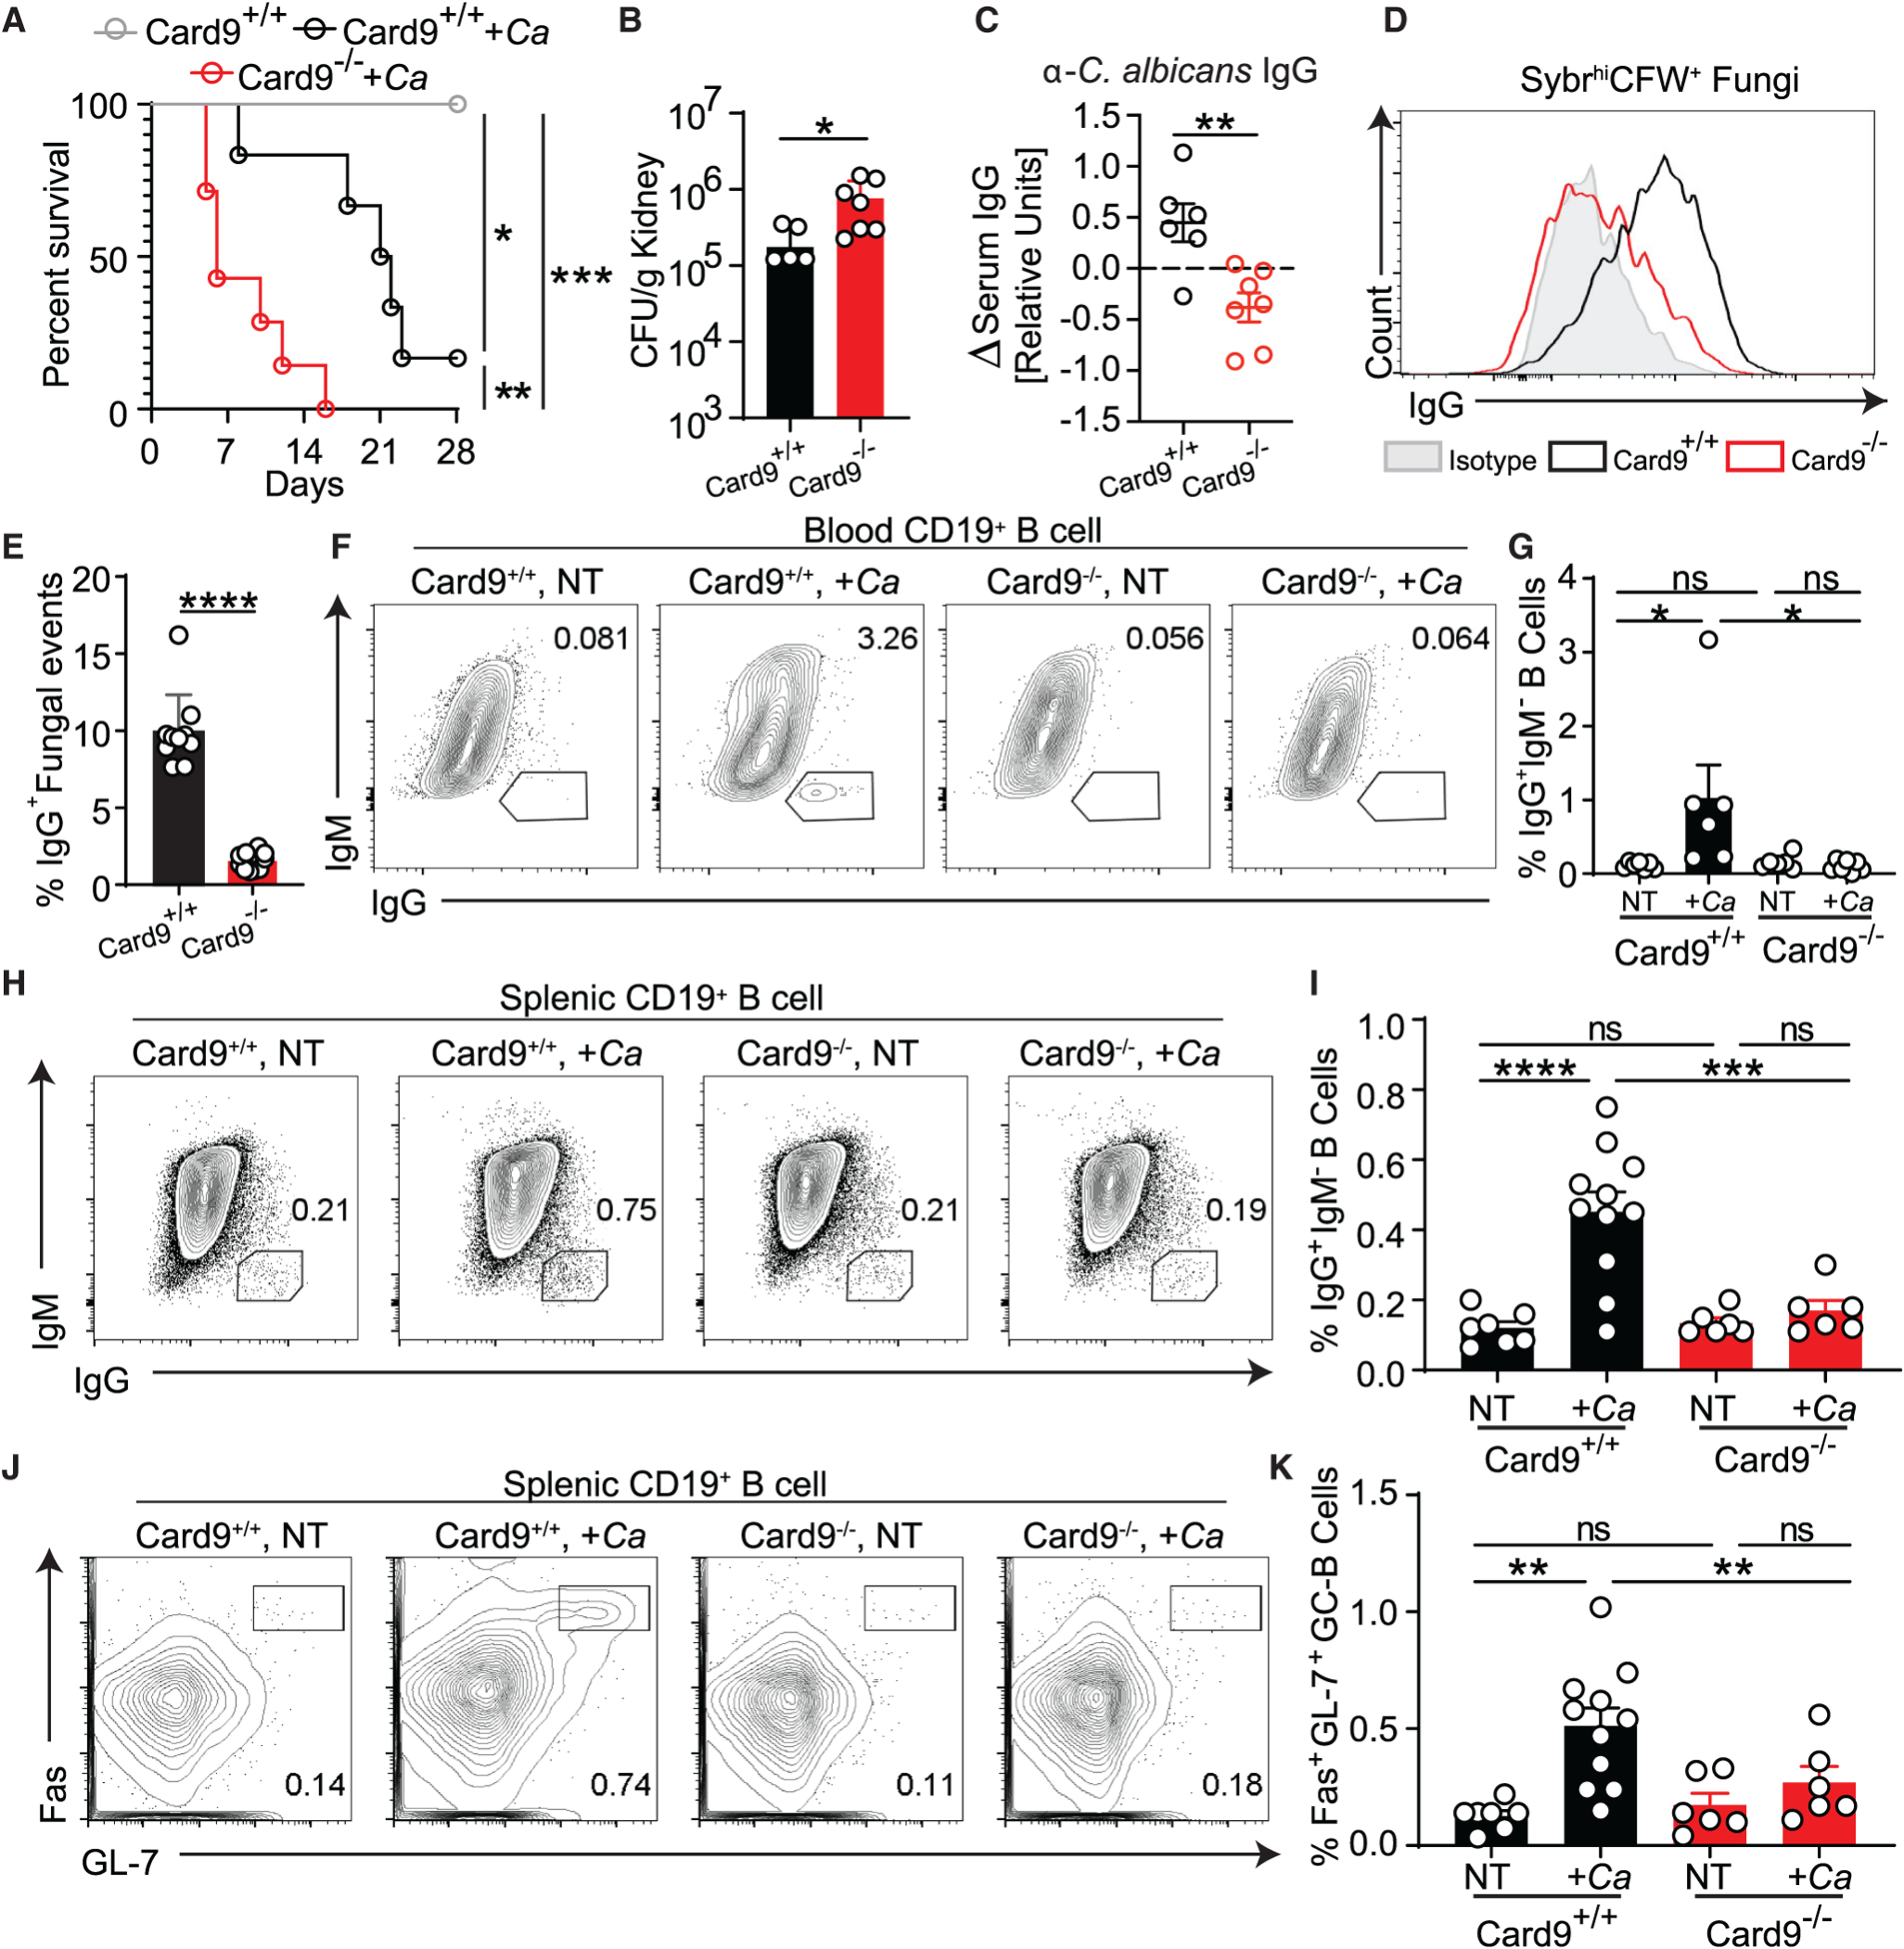
Figure 5. CARD9 is critical for the GC-dependent generation of antifungal IgG antibodies.

(A–C) Cyc-induced gut-to-system fungal dissemination was induced in Card9+/+ and Card9−/− mice.
(A and B) Disease morbidity assessed by survival (A) and C. albicans systemic spread to the kidneys (B). C. albicans detection failed in one mouse, which was excluded from the analysis.
(C) Change in anti-C. albicans serum IgG after mice became moribund (14 days after infection) relative to pre-infection titers.
(D and E) MultiKAP analysis of anti-fungal antibodies in healthy Card9+/+ and Card9−/− mice.
(A–E) Statistical analysis was performed using log rank Mantel-Cox test (A) or Mann-Whitney test (B, C, and E). Card9+/+, n = 6; Card9+/+ +Ca, n = 6; Card9−/− +Ca, n = 7. Data are representative of two independent experiments.
(F and G) Systemic IgG and B cell responses of Card9+/+ and Card9−/− mice 2 weeks after intraperitoneal injection with C. albicans. The B cell compartment in blood samples from individual mice was analyzed by flow cytometry. One-way ANOVA followed by Tukey’s multiple comparisons test. Card9+/+ NT, n = 7; Card9+/+ +Ca, n = 6; Card9−/− NT, n = 6; Card9−/− +Ca, n = 6. Data are representative of two independent experiments.
(H–K) Systemic IgG and B cell responses of Card9+/+ and Card9−/− mice after intraperitoneal injection with C. albicans. The B cell compartment in spleen samples from individual mice was analyzed by flow cytometry. One-way ANOVA followed by Tukey’s multiple comparisons test. Card9+/+ NT, n = 7; Card9+/+ +Ca, n = 11; Card9−/− NT, n = 6; Card9−/− +Ca, n = 6. Data are representative of three independent experiments.
Each dot represents an individual mouse. Error bars indicate SEM. ns, p ≥ 0.05; *p < 0.05; **p < 0.01; ***p < 0.001; ****p < 0.0001. See also Figure S4.
