. 2021 Feb 25;10:e62312. doi: 10.7554/eLife.62312

Figure 1. RNAi Screen identified Non-stop (Not) as an ECs identity supervisor.

(A) Schematic diagram of midgut differentiation and an outline of the Ub/UbL screen (see text for details). The Notch ligand, Delta, is expressed on the surface of Intestinal stem cells (ISC) marked in red. (B) Phenotypes expected from positive hits: 1. Loss of expression of EC-specific GFP (expressed only in fully differentiated ECs using MyoIA>Gal4/Gal80ts system), along with ectopic expression of the ISC marker Delta (red). 2. Polyploid cells that ectopically express Delta and retain expression of GFP. (C–F) Confocal images using UAS-LacZ (C, E) or UAS-Non-stop RNAi (D, F) along with UAS-GFP expressed under the control of MyoIA>Gal4/Gal80ts system. Scale bar is 10 μM. The stem cell marker Delta (C, D) and EE marker Prospero (E, F) are shown in red. (G, H) Quantification of three biological repeats of experiments similar to that shown in C-F. *(I, J) Expression of UAS-Non-stop RNAi, but not control, in ECs for 48 hr using MyoIA>Gal4/Gal80ts results in ectopic expression of the Notch-reporter (red) in polyploid cells. (K, L, Q) Expression of the escargot progenitor enhancer reporter M5-4-LacZ in control or Non-stop-targeted ECs (red). Yellow arrows points to cells shown in the insets. White arrows in L are examples of EC-like polyploid cells ectopically expressing the reporter. (M, N) Loss of Non-stop in ECs resulted in an increase in the mitosis marker p-H3 in small cells. (O, P, P’) Loss of Non-stop in ECs impairs gut integrity as evident by the leakage of blue-colored food into the abdomen (smurf assay); 24% of Non-stop-RNAi flies show loss of gut integrity versus 0% in control flies (n = 50, 44 respectively, p<0.0001) (Q) Quantification of M5-4 positive PPCs in control and upon targeting Non-stop in ECs. (*** = p<0.001 **p<0.01). (R) Survival analysis of flies expressing the indicated transgenes in ECs under the control of MyoIA-Gal4/Gal80ts (Log-rank test ****=p<0.0001).
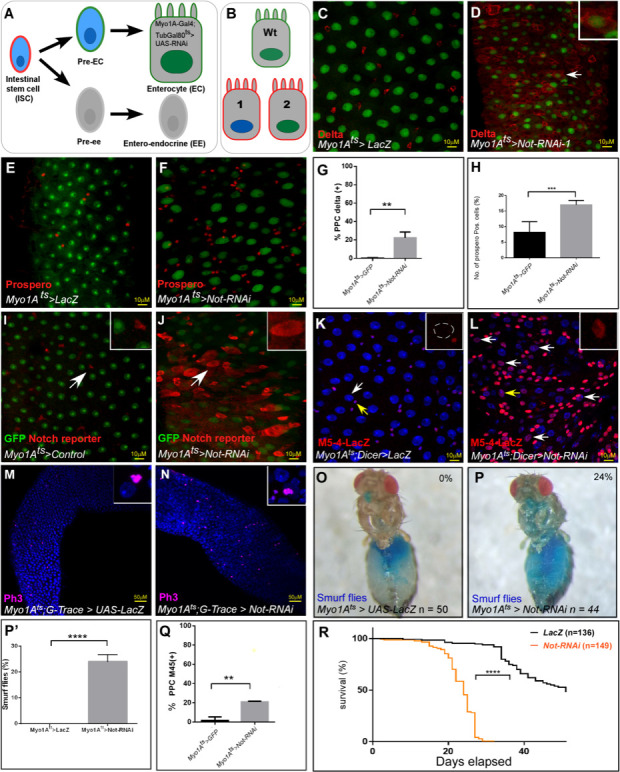
Figure 1—source data 1. Summary of the screen Ub/UbL screen results.
Figure 1—source data 2. Results of primary and secondary transgenic RNAi screens.

Figure 1.

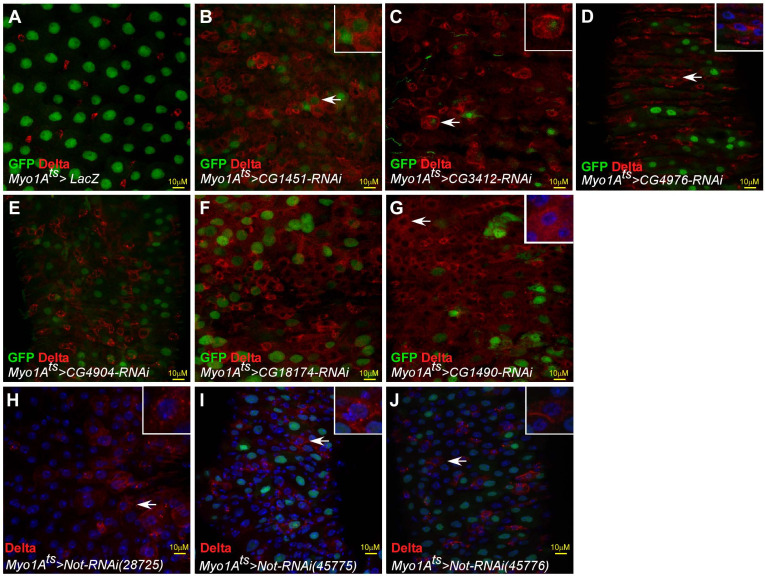
Figure 1—figure supplement 1. Examples of positive hits of the Ub/UbL screen.

Figure 1—figure supplement 1.

(A–J) Confocal images of the midgut tissue and the indicated transgenes expressed in ECs using the MyoIA-Gal4/Gal80ts. White arrows indicate cells shown in insets. Scale bar is 10 μM MyoIA>UAS-GPF marks fully differentiated ECs, Delta is shown in red, and DAPI (blue) marks DNA. (A-G) Examples of positive hits from the screen. (H–J) Loss of Non-stop in ECs using three independent UAS-RNAi transgenic lines results in loss of EC identity.

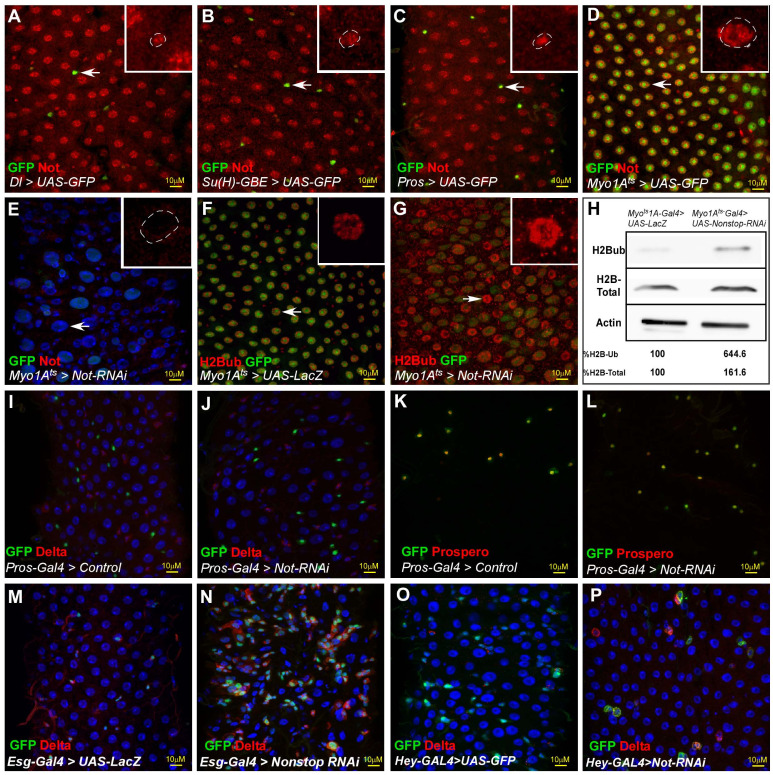
Figure 1—figure supplement 2. Characterization of Non-stop in midgut cells (A–G).

Figure 1—figure supplement 2.

(AG)Confocal images of the midgut tissue and the indicated transgenes expressed in EC using the MyoIA-Gal4/Gal80ts. (A–D) Non-stop is expressed in all midgut cells. Expression of endogenous Non-stop protein (red) was tested relative to the expression of UAS-GFP that was expressed under the cell-specific GAL4 drivers: Dl>GAL4 (ISC); Su(H)>Gal4 (EBs); Prospero Gal4 (EE’s) and MyoIA>Gal4 (ECs). Arrow point to cells shown in insets. (E) Expression of Non-stop upon activating UAS-Non-stop-RNAi in ECs. (F, G) Level of H2Bub (red) in midguts expressing the control (F), or UAS-Non-stop-RNAi (G) in ECs using the MyoIA>Gal4, UAS-GFP system. (H) Western-blot analysis of H2Bub and H2B in midgut derived extracts of the indicated genotypes. Actin serves as a loading control. (I–L) Expression of Delta (I, J, red) or Prospero (K, L, red) in midguts expressing control (I, K) or the UAS-Non-stop RNAi (J, L) in EE using prospero>GAL4ts, UAS-GFP system. (M–P) Expression of Delta (red) in midguts expressing control (M, O) or the UAS-Non-stop RNAi (N, P) in progenitor cells using esg>GAL4ts, UAS-GFP system (M, N), or predominantly in EBs using Hey GAL4ts, UAS-GFP (O,P). Scale bar is 10 μM.