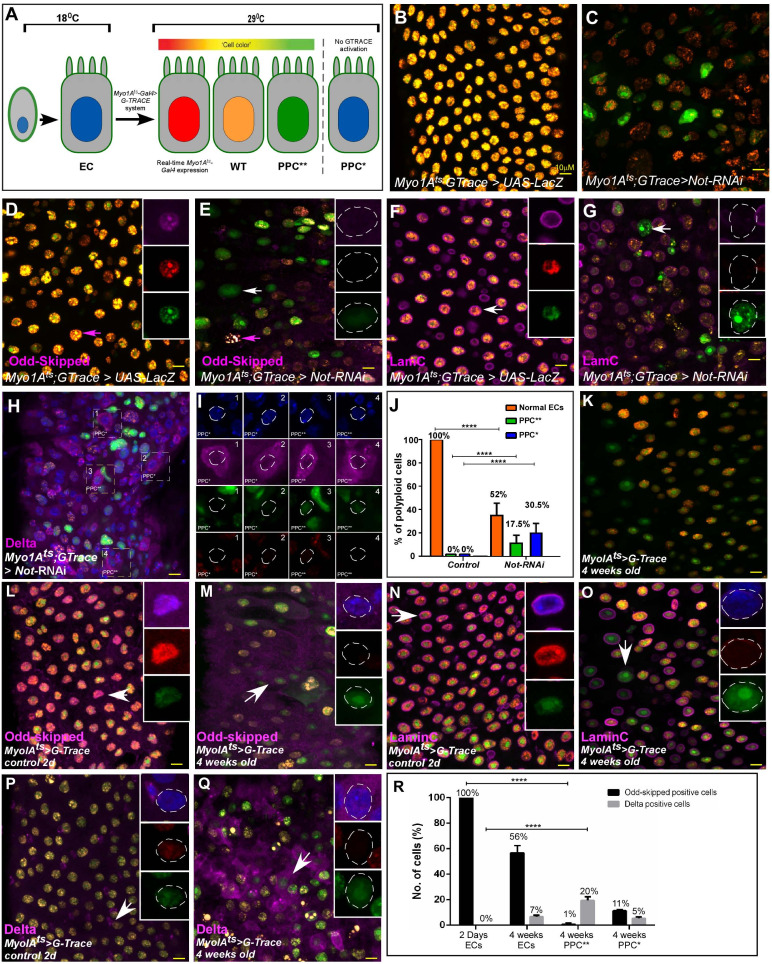
Figure 2. G-TRACE-Lineage characterization of Non-stop targeted young ECs and, aged ECs.
(A) Schematic diagram of EC-G-TRACE-lineage tracing system adapted from Flint Brodsly et al., 2019. PPC** (RFP-GFP+), are EC that are no-longer differentiated. PPC* (RFP-GFP-) are miss-differentiated progenitors. (B–Q) Confocal microscopy of midguts expressing the indicated transgenes, under the control of MyoIAts G-TRACE system using the indicated antibodies. DAPI (blue) marks DNA. Arrows point to cells shown in the insets with individual far-RFP, RFP and GFP channels. scale bar is 10 μM. (B–G) G-TRACE of EC in control young midgut expressing either UAS-LacZ (B, D, F), or UAS-Non-stop- RNAi (C, E, G). Arrows point to cells shown in the insets with individual far-RFP, RFP and GFP channels. (H–I) Expression of Delta (purple) on the surface of the indicated PPCs. Numbered cells are shown in (I) with individual channels dashed circle outlines the nucleus. (J) G-TRACE-based quantification of PPC types (wildtype, PPC* PPC**) observed in control midguts or where Non-stop was targeted ECs. (K–Q) Confocal microscopy of midguts expressing MyoIAts> G-TRACE system using the indicated antibodies. (B, L, N, P) G-TRACE of EC in young, and (K, M, O, Q) old midguts. (R) Quantification of indicated PPCs expressing Odd-Skipped, and Delta similar to experiments shown in L-O (**** = p<0.0001).


